5
This concept of enhanced mass resolution can be best
visualized looking at the broad spectrum of pesticides
with their inherent diversity of chemical compound
classes. Figure 5 shows more than 700 pesticides and
POPs compounds and their frequency distribution
according to their “mass defect” values, see also the
Thermo Fisher Scientific Pesticides Analyzer Reference
Manual (Thermo Fisher Scientific, 2010). All of the
compounds show a significant shift away from the organic
hydrocarbon background to lower accurate masses due to
their accurate mass.
The graphics in Figure 5 also shows the effect of increased
mass resolution. The “selectivity window” with increas-
ingly narrower mass peaks allows a good separation from
hydrocarbon matrix interferences. Using a wider Q1 mass
window beyond 0.7 Da with nominal or wide resolution
setting of 1.5 Da will include the interfering matrix
compounds into the fragmentation processes in the
collision cell exhibiting high background noise. “Closing”
the selectivity window to 0.2 Da using U-SRM on the
TSQ Quantum XLS Ultra provides efficient selectivity for
all shown compounds from matrix interferences.
Isolation of the Precursor Ion from Isobaric
Matrix
Increased analyte selectivity is obtained during U-SRM
with a narrow pre-selection of the precursor ion. The
situation of having the pesticide lindane detected in a dirty
matrix sample is shown in Figure 6 and Figure 7. During
standard SRM operation, the Q1 nominal mass resolution
of 0.7 Da (at the target mass
m/z
219) transmits the
lindane ion the collision cell for fragmentation along with
a number of matrix ions. This can lead to isobaric
interference and an increase in chemical noise. This
problem can be exacerbated for systems that incorporated
even wider precursor ion windows, such as the commonly
seen “wide” or “open” resolution settings of > 1.0 Da
FWHM. These wider settings can give an artificial
impression of sensitivity, as the number of ions transmit-
ted increases because noise can quickly appear in dirtier
matrix samples.
In contrast to the standard or “wide” Q1 window setting,
U-SRM “closes” the mass window in Q1 to < 0.2 Da, as
seen in Figure 7. The increased resolution allows the
lindane peak to be efficiently isolated for transmission
to the collision cell in the absence of interfering matrix
components. The resolution of the HyperQuad is such
that any delta mass defect between target and matrix
ions can be exploited. This is why U-SRM most
efficiently eliminates isobaric interference effects on
the precursor ion.
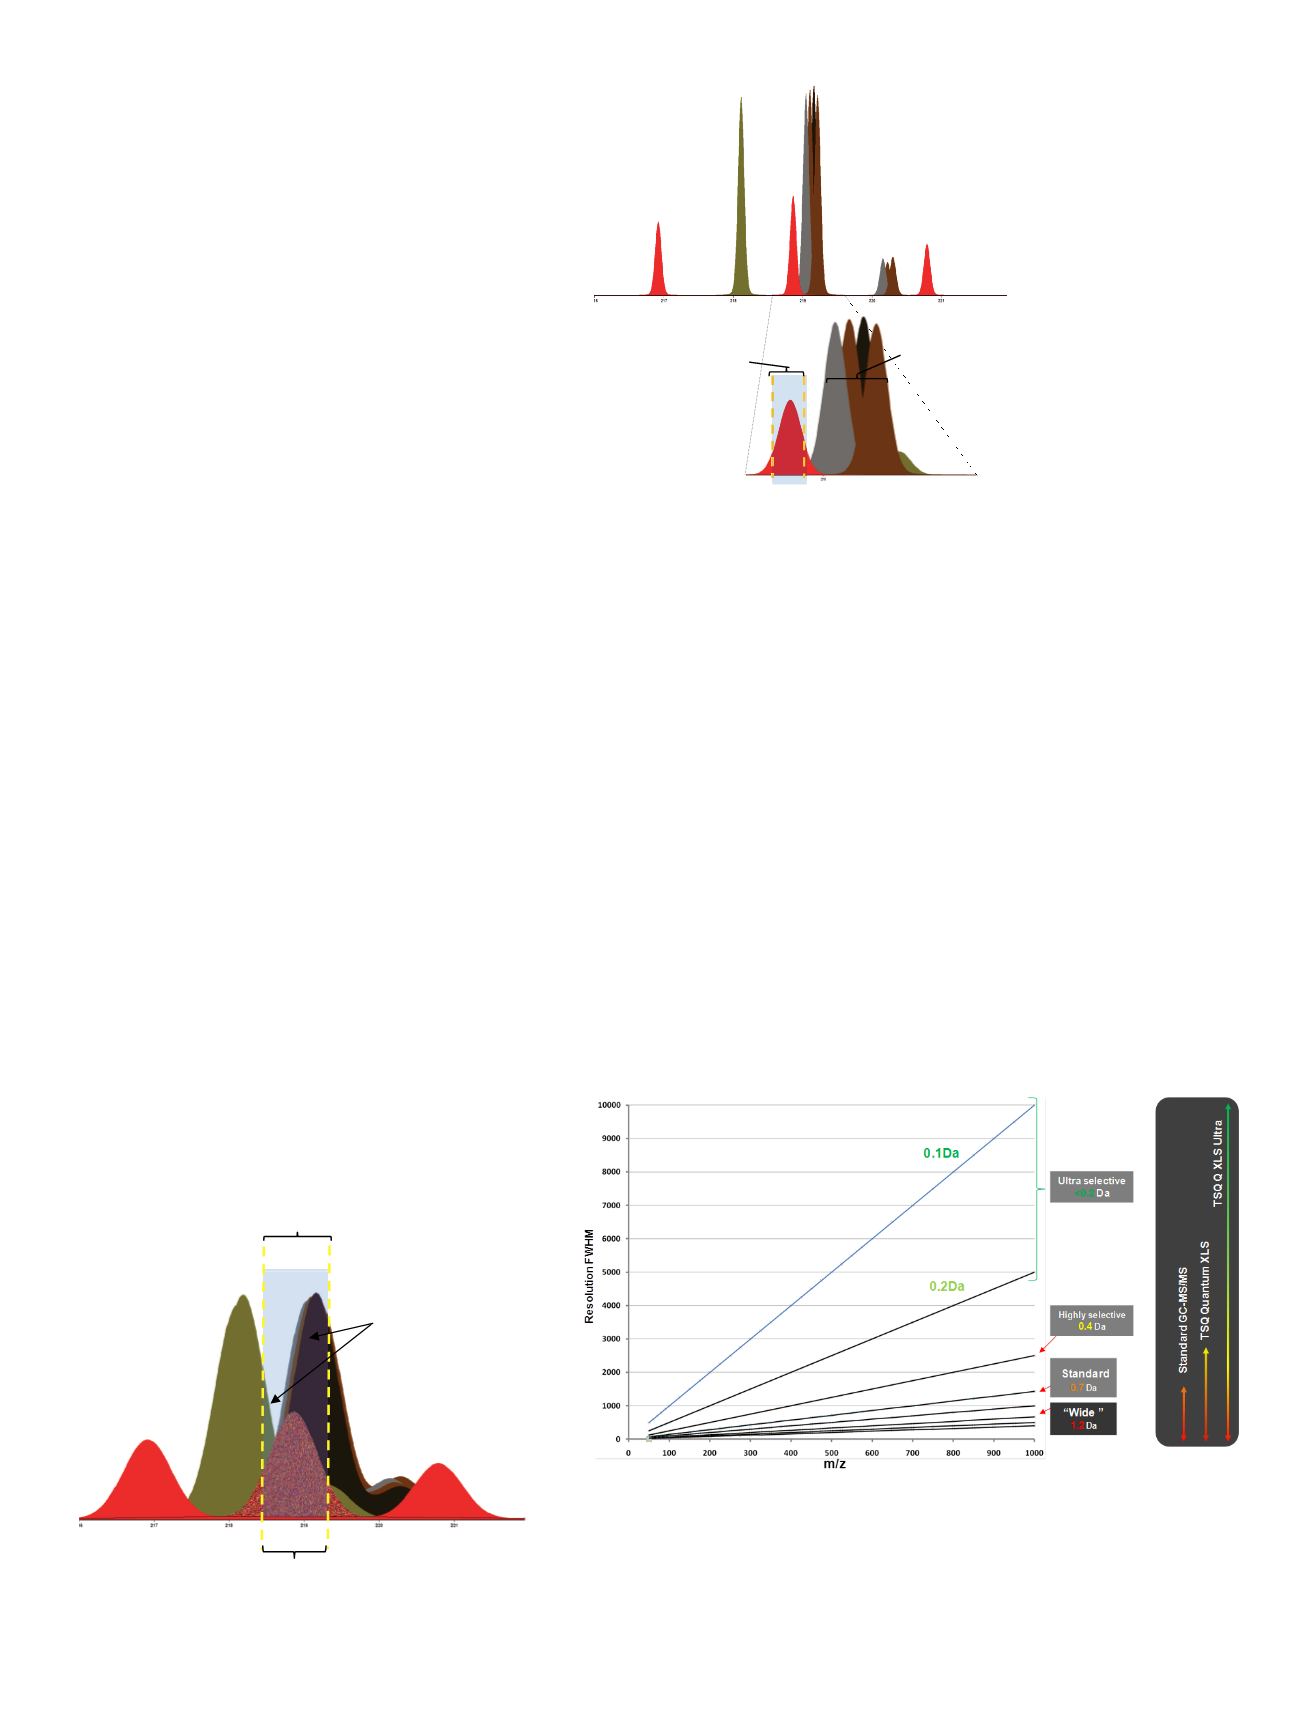
The difference in the mass resolution effect becomes even
more evident comparing the resolution power of different
triple quadrupole instrument types in Figure 8. The graph
shows the calculated resolution over mass (peak width at
half peak height, FWHM) for different mass peak width
settings. Starting on the bottom from the “wide” setting
with 1.2 Da peak width and the “standard” setting with
Q1= 218.9
m/z
(0.7 Da res.)
Q1= 0.7Da
Matrix components
transmitted through
Q1 during SRM
Q1 Transmission Window
217
219
221
Q1= 218.86 m/z (0.1 Da res.)
Q1= 0.1Da
219
217
221
219
HyperQuad does not
allow matrix through
through Q1 during
U-SRM
Figure 6: Precursor ion selection for lindane at 0.7Da FWHM (Q1)
in standard SRM mode. Matrix components are transmitted to the
collision cell during SRM acquisition.
Figure 7: Precursor ion selection during U-SRM
Figure 8: Mass resolution power of different instrument types


