Screening Efficiency
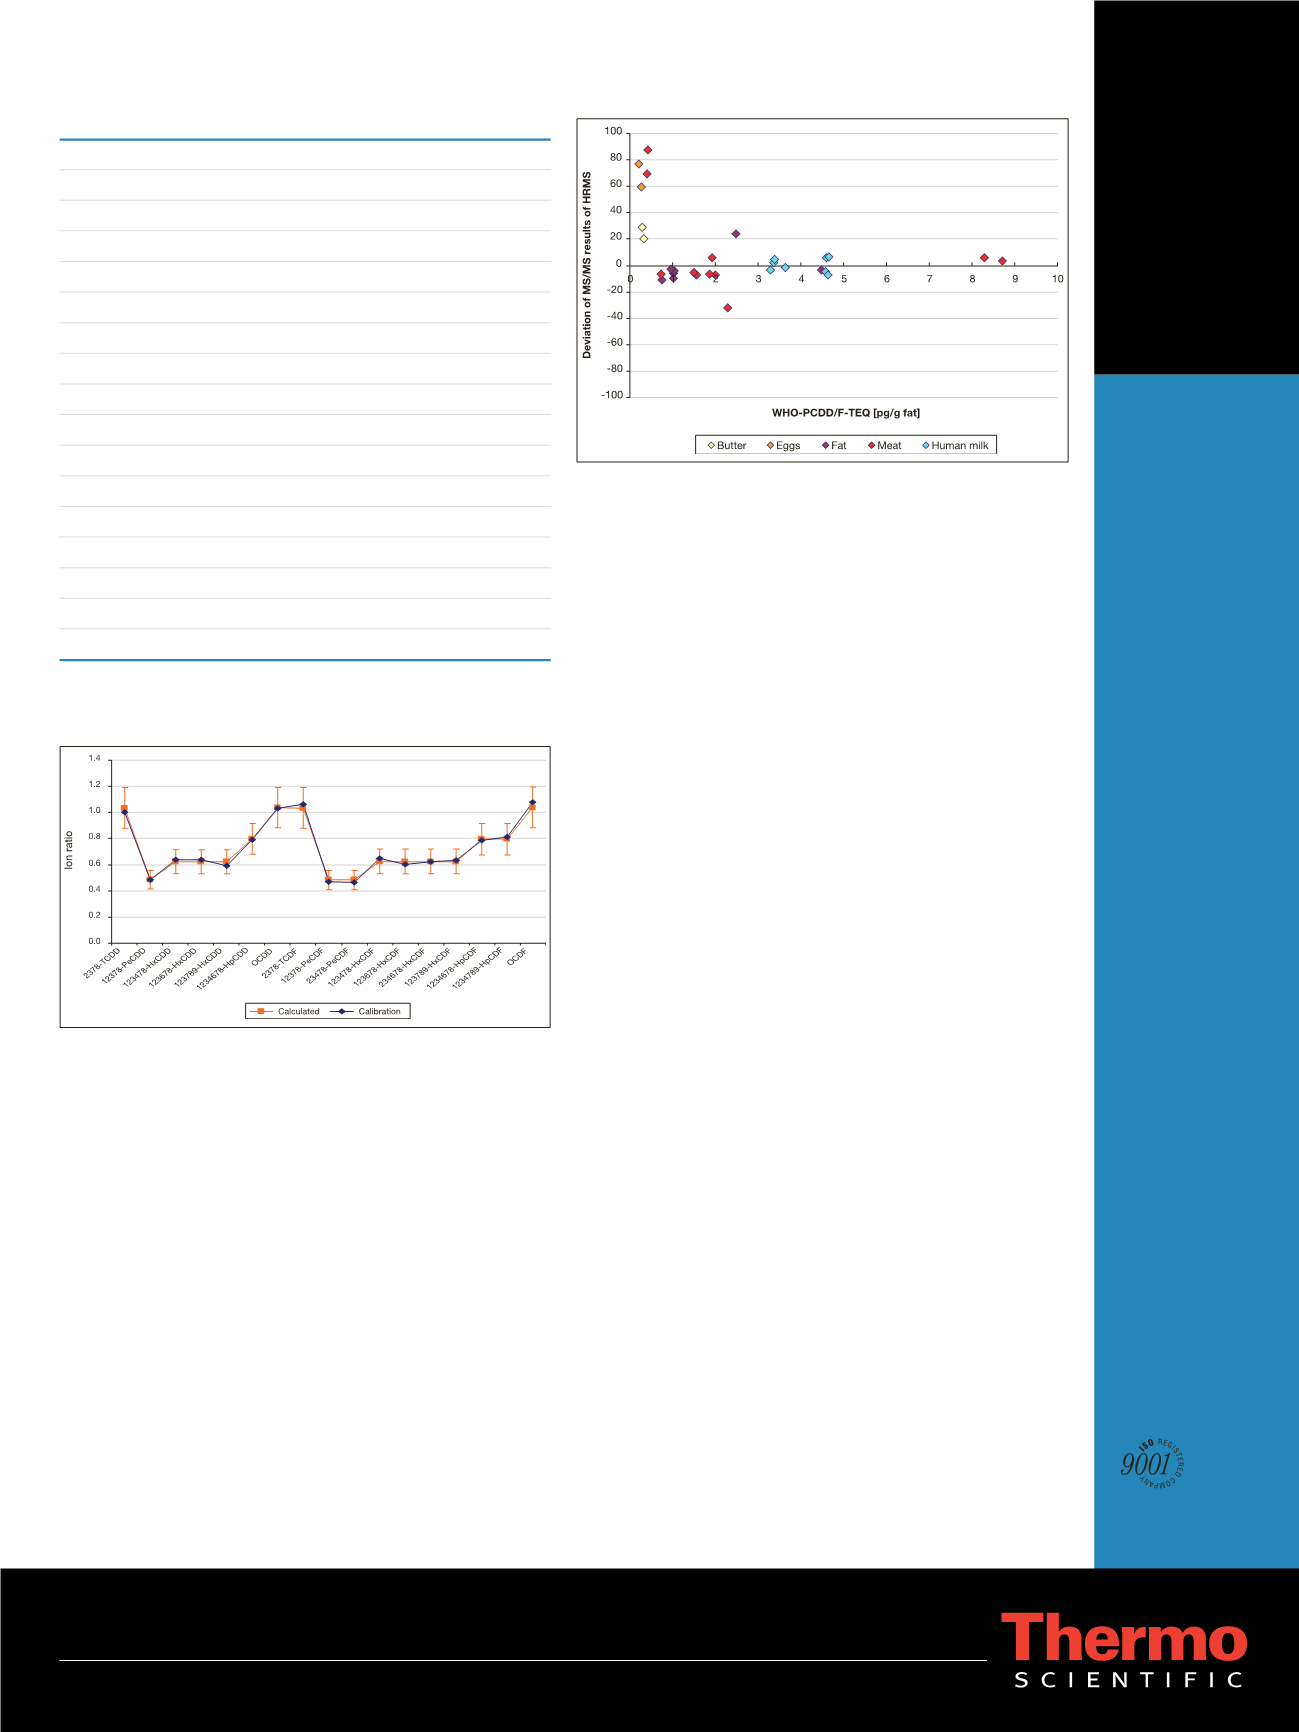
A direct comparison of calculated WHO-PCDD/F-TEQ
in pg/g fat (or wet weight for fish) was made by analyzing
the same sample extracts on both the TSQ Quantum XLS
Ultra and the DFS HRMS. The data obtained are given
in Figure 6. Very good correlation with HRMS data was
observed in the real calculated values down to ca. 0.5
(WHO-PCDD/F-TEQ) pg/g level indicating that a highly
efficient screening method is possible with TSQ Quantum
XLS Ultra. The sensitivity and selectivity obtained with the
technique made this possible. This means, in addition to
a very low false negative rate, very few compliant samples
are likely to be directed to subsequent confirmatory analysis.
Conclusions
•
The Thermo Scientific TSQ Quantum XLS Ultra is a highly
applicable screening tool for PCDD/Fs in food and feed.
•
Strong correlation, between the results of GC-MS/MS
and GC-HRMS within acceptable limits were observed
around the level of interest for a high percentage of the
food and feed samples tested.
•
Measured ion ratios for identity confirmation are
predictable and can therefore be tested against
theoretical values.
•
A different approach for LOQ calculation (from the
signal/noise ratio, employed on HRMS systems) is
required due to the inherent low noise of the GC-MS/MS
system. For this, the lowest calibrated concentration
was used.
References
1. European Food Safety Authority; Results of the monitoring of dioxin
levels in food and feed. EFSA Journal 2010; 8(3):1385 [36 pp.].
doi:10.2903/j.efsa.2010.1385. Available online:
2. Commission Regulation (EC) No 152/2009 of 27 January 2009 (OJ L 54,
26.2.2009, p. 1–130), Commission Regulation (EC) No 1883/2006 of 19
December 2006 (OJ L 364, 20.12.2006, p. 32–43)
Part of Thermo Fisher Scientific
AN52266_E 12/11M
Thermo Fisher Scientific,
Austin, TX USA is ISO Certified.
Legal Notices:
©2011 Thermo Fisher Scientific Inc. All rights reserved. ISO is a trademark of the International Standards Organization.
Silcosteel and Restek are registered trademarks of Restek Corporation. All other trademarks are the property of Thermo Fisher Scientific Inc. and its
subsidiaries. This information is presented as an example of the capabilities of Thermo Fisher Scientific Inc. products. It is not intended to encourage use
of these products in any manners that might infringe the intellectual property rights of others. Specifications, terms and pricing are subject to change.
Not all products are available in all countries. Please consult your local sales representative for details.
In addition to these
offices, Thermo Fisher
Scientific maintains
a network of represen
tative organizations
throughout the world.
Africa-Other
+27 11 570 1840
Australia
+61 3 9757 4300
Austria
+43 1 333 50 34 0
Belgium
+32 53 73 42 41
Canada
+1 800 530 8447
China
+86 10 8419 3588
Denmark
+45 70 23 62 60
Europe-Other
+43 1 333 50 34 0
Finland/Norway/
Sweden
+46 8 556 468 00
France
+33 1 60 92 48 00
Germany
+49 6103 408 1014
India
+91 22 6742 9434
Italy
+39 02 950 591
Japan
+81 45 453 9100
Latin America
+1 561 688 8700
Middle East
+43 1 333 50 34 0
Netherlands
+31 76 579 55 55
New Zealand
+64 9 980 6700
Russia/CIS
+43 1 333 50 34 0
South Africa
+27 11 570 1840
Spain
+34 914 845 965
Switzerland
+41 61 716 77 00
UK
+44 1442 233555
USA
+1 800 532 4752
Mean Recovery (%)
Relative Standard Deviation (%)
2,3,7,8-TCDF
83
11
1,2,3,7,8-PeCDF
105
12
2,3,4,7,8-PeCDF
101
13
1,2,3,4,7,8-HxCDF
106
14
1,2,3,6,7,8-HxCDF
107
15
2,3,4,6,7,8-HxCDF
104
17
1,2,3,7,8,9-HxCDF
97
17
1,2,3,4,6,7,8-HpCDF
105
18
1,2,3,4,7,8,9-HpCDF
99
18
OCDF
90
26
2,3,7,8-TCDD
87
12
1,2,3,7,8-PeCDD
105
13
1,2,3,4,7,8-HxCDD
110
13
1,2,3,6,7,8-HxCDD
108
14
1,2,3,7,8,9-HxCDD
104
16
1,2,3,4,6,7,8-HpCDD
104
17
OCDD
94
24
Table 5: Recoveries of
13
C-labeled internal PCDD/F standards for food
samples (n = 42)
Figure 5: Theoretically calculated ion ratios for SRM analysis of tetra thru
octa PCDD/F congeners in addition to the real values obtained from a
calibration sequence using the TSQ Quantum XLS Ultra. Error bars show typi-
cal ±15% QC tolerance.
Figure 6: Deviations of WHO-PCDD/F-TEQ of GC-MS/MS results of
GC-HRMS (%) for food and human milk samples


