Page 7 of 8
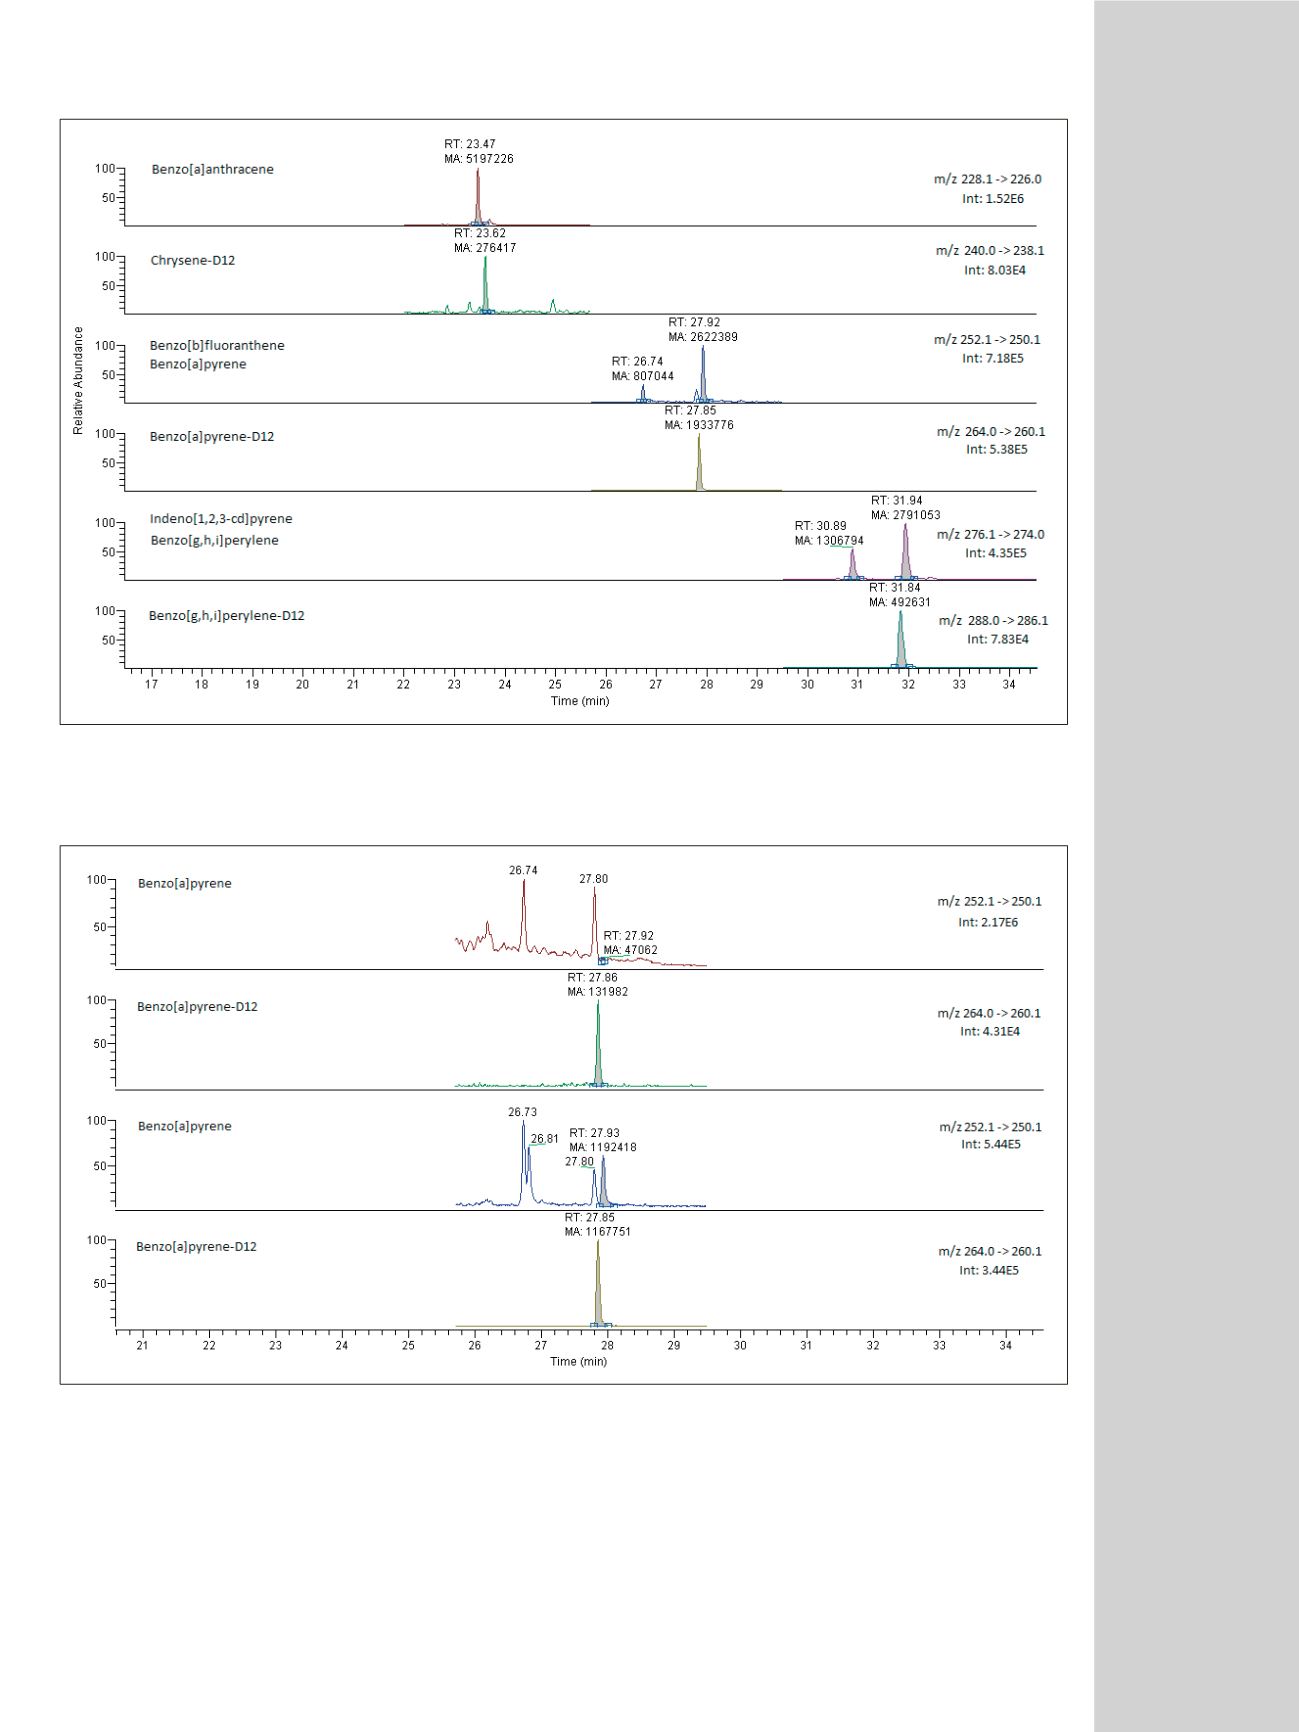
Figure 3: Chromatogram of
m/z
252.1 -> 250.1 transition (for B(b)F, B(k)F and B(a)P- marked) in red snapper fish sample spiked with the actual oil spill sample
from the Gulf of Mexico. Last two chromatograms representing the same sample (same transition and the relevant internal standard) spiked with standard
addition at 5 ng/g PAHs concentration level.
Figure 2: Chromatogram of FAPAS
®
T0642 smoked fish quality control sample showing peaks of the measured B(a)A, B(b)F, B(a)P, B(g,h,i)P, I(1,2,3-c,d)P PAHs
and the respective internal standards


