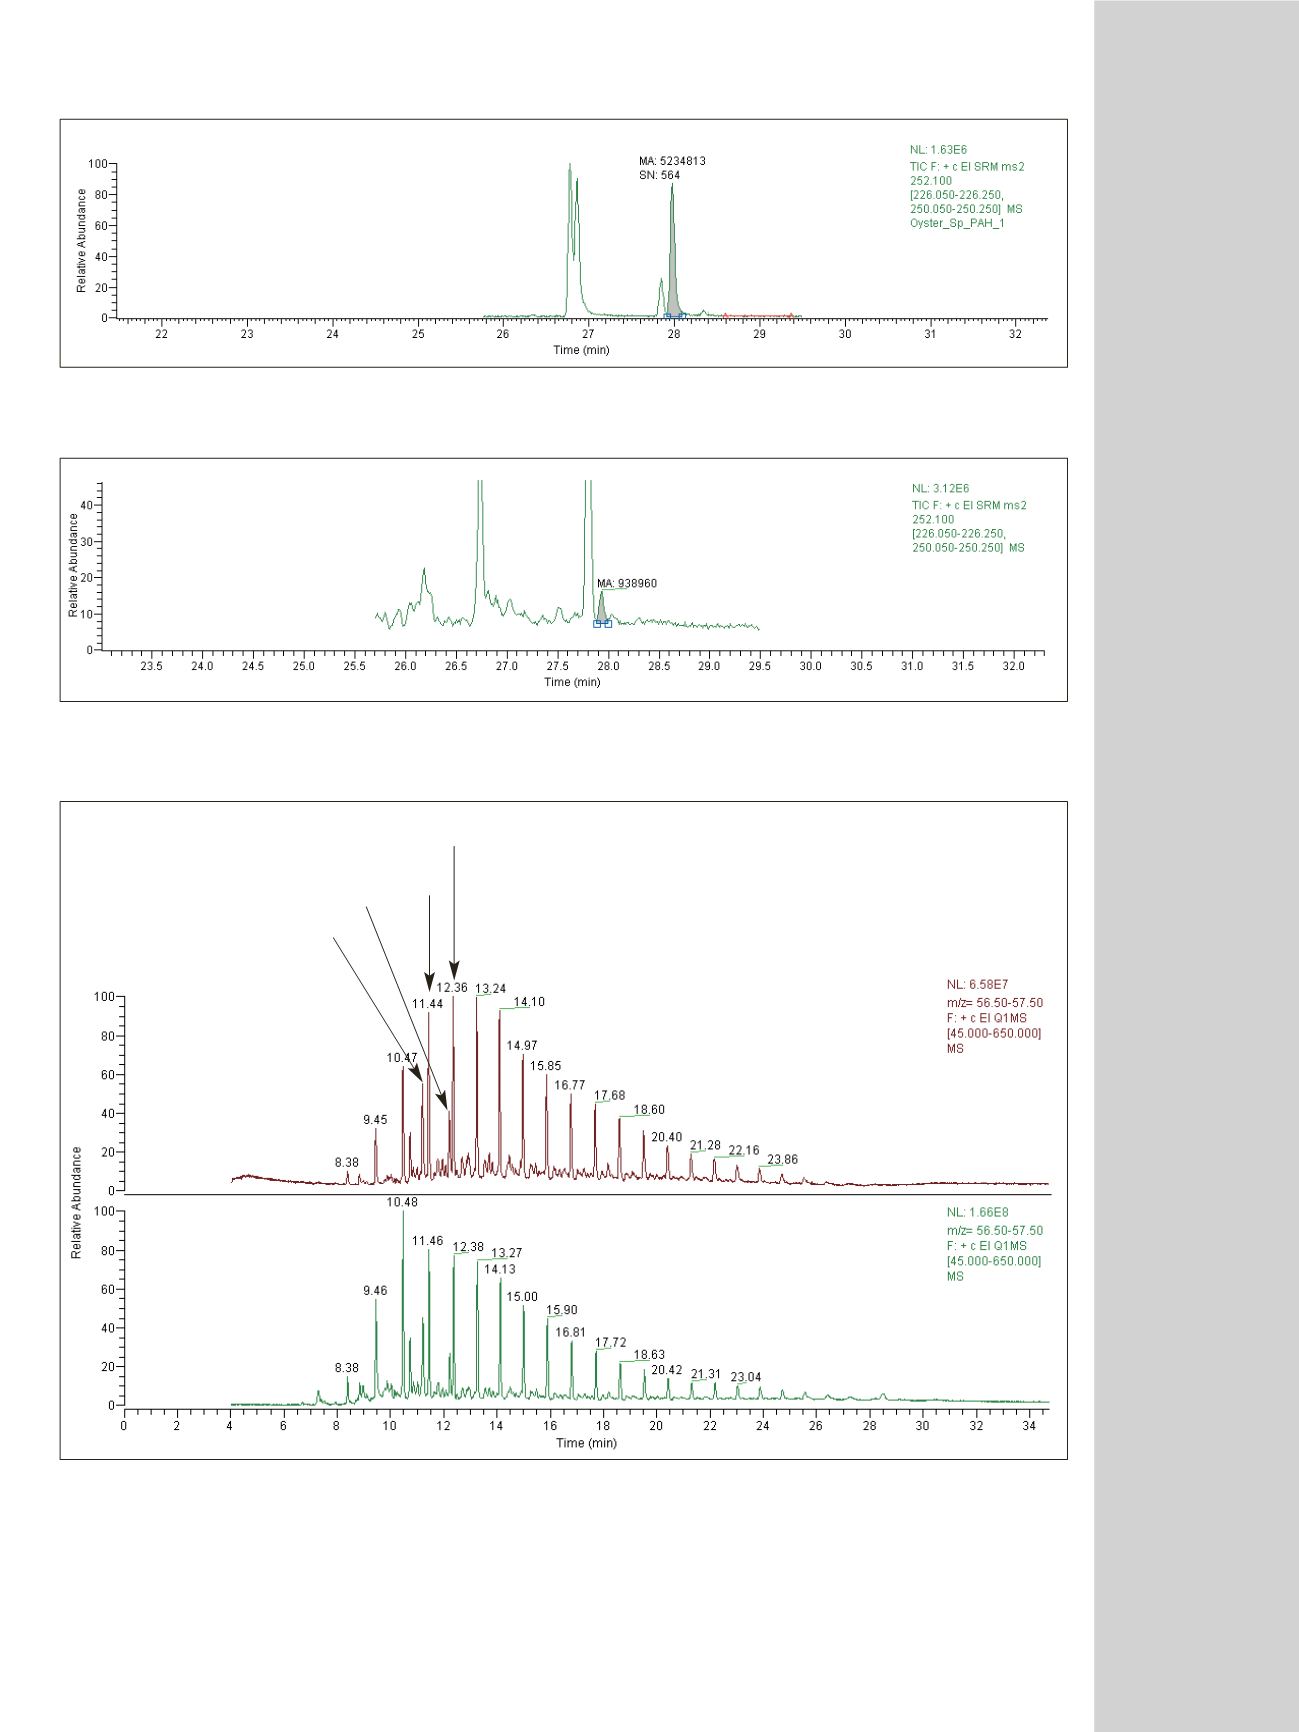
Figure 4: Hydrocarbon profile of crude oil sample taken from the Gulf of Mexico in late May 2010 by direct analysis (top) and after 5 mg/kg spiking into oyster
sample (bottom) showing
m/z
57
Figure 2: Chromatogram of oyster sample spiked with 10 ng/g B(a)P
Figure 3: Chromatogram of oyster sample spiked with 5 µg/g crude oil sample taken from the Gulf of Mexico in late May 2010 and found to contain 5 ng/g B(a)P
Directly injected Mexican Gulf
oil spill sample
m/z
57.0
Pristane
Phytene C17
C18
Mexican Gulf oil spill sample in
oyster after sample preparation
m/z
57.0


