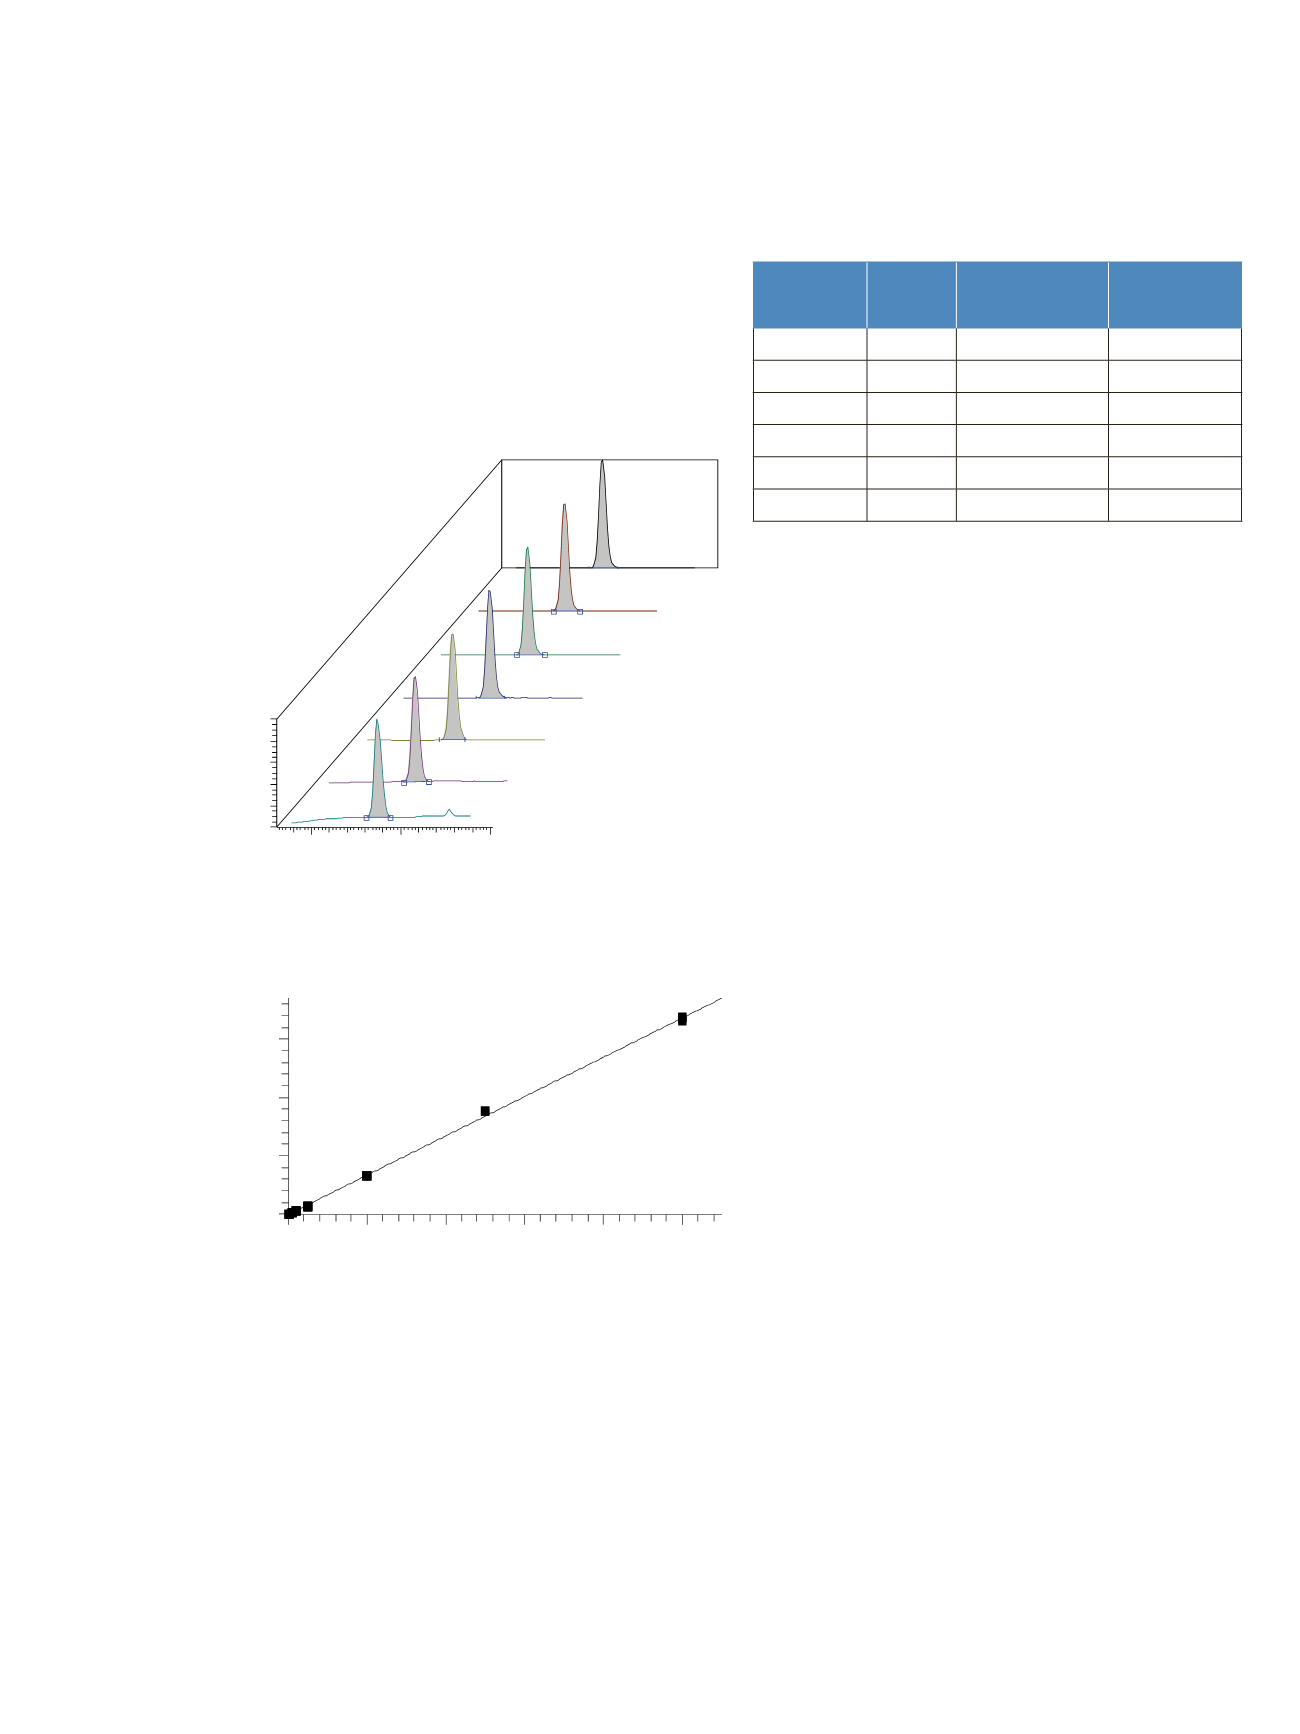
The quantitative calibration has been performed in a
wide concentration range from 1 ppb to 500 ppb. Figure
4 shows the chromatogram peaks of NDMA from all the
calibration runs. In all cases the NDMA peak shape is
perfectly symmetrical, no tailing occurs and the peak area
integration provides very reliable values without the need
for any further manual corrections. The linear calibration
of NDMA used to quantify the samples is shown in
Figure 5 with very good correlation of R
2
better than 0.99.
The same good calibration precision is achieved for all
nitrosamines in this TSQ 8000 GC-MS/MS method.
LOQ Determination
The calculation of the LOQ and LOD was based on
the S/N achieved for a chromatographic peak.The LOQ
calculation is based on the level of S/N 10, and LOD
values are calculated based on a S/N of 3.
7.5
8.0
8.5
Time (min)
0
20
40
60
80
100
Relative Abundance
RT: 7.87
AA: 2680494
SN: 5489
RT: 7.87
AA: 1407679
SN: 6272
RT: 7.87
AA: 513180
SN: 4012
RT: 7.87
AA: 113180
SN: 333
RT: 7.87
AA: 43810
SN: 183
RT: 7.87
AA: 21558
SN: 309
RT: 7.87
AA: 6336
SN: 31
Figure 4. NDMA calibration runs from 1 ppb (bottom) to 500
ppb (top)
0
100
200
300
400
500
ng/mL
0.0
0.5
1.0
1.5
Area Ratio
Figure 5. Linear calibration function for NMDA from 1 ppb to
500 ppb
4
Compound
S/N @
1ppb
Calculated LOQ
(ppb)
Calculated LOD
(ppb)
NDMA
13
1.0
0.25
NDEA
231
0.05
0.02
NDBA
23
0.5
0.20
NPIP
10
1.0
0.50
NMOR
40
0.3
0.10
NPYR
24
3
1.0
Table 2. Calculation of the method LOQ and LOD
Confirmation
For compound confirmation the ion ratio check provided
by the Thermo Scientific TraceFinder™ quantitation
software was used by comparing the ion intensity of
the second acquired SRM transition with the first SRM
used for quantitation. The precision for the ion ratio was
calculated using the three replicate standard runs over
the complete concentration range from 1 ppb to 500 ppb
and is shown in Table 3. Although the detected ions all
are in the low mass range and potentially subject to many
interferences the precision of the product ion ratio is very
good in the range of 1-4%.
For quality control purposes in sample analyses the
confirmation of a positive result is done by the ion
ratio check during the quantitation data processing in
TraceFinder software. The ion ratio of the two acquired
product ions is required to stay within +/- 5% (10%) for
all compounds, compared to the calibrated value from
the standard runs. This provides a solid safety margin for
routine sample measurements. Table 3 indicates the used
average value (AVG) of the ion ratio for all nitrosamines
investigated.
Sample Measurements
A number of samples have been measured, including
blanks and spiked beer samples. The results of a blank
sample are shown in Table 4. The found low NDMA
concentration in this sample has been calculated
below the calibration, and also below LOQ. The blank
sample could be confirmed to be free from nitrosamine
compounds at the given LOQ.


