The collision cell (Q2) gas pressure and collision
energy were optimized for PCDD/F measurement. The
monitored SRM transitions as well as the GC conditions
are given below in Table 3.
The results of the GC-MS/MS measurements were
compared with routine GC-HRMS measurements using
the DFS High Resolution MS (Thermo Scientific, Bremen,
Germany).
Results and Discussion
Selectivity, Sensitivity and Quantitative Performance
In order for a screening technique to be truly efficient it
needs to be able to perform at a level that closely
correlates with high resolution confirmatory techniques.
The first prerequisite of any such technique is sensitivity
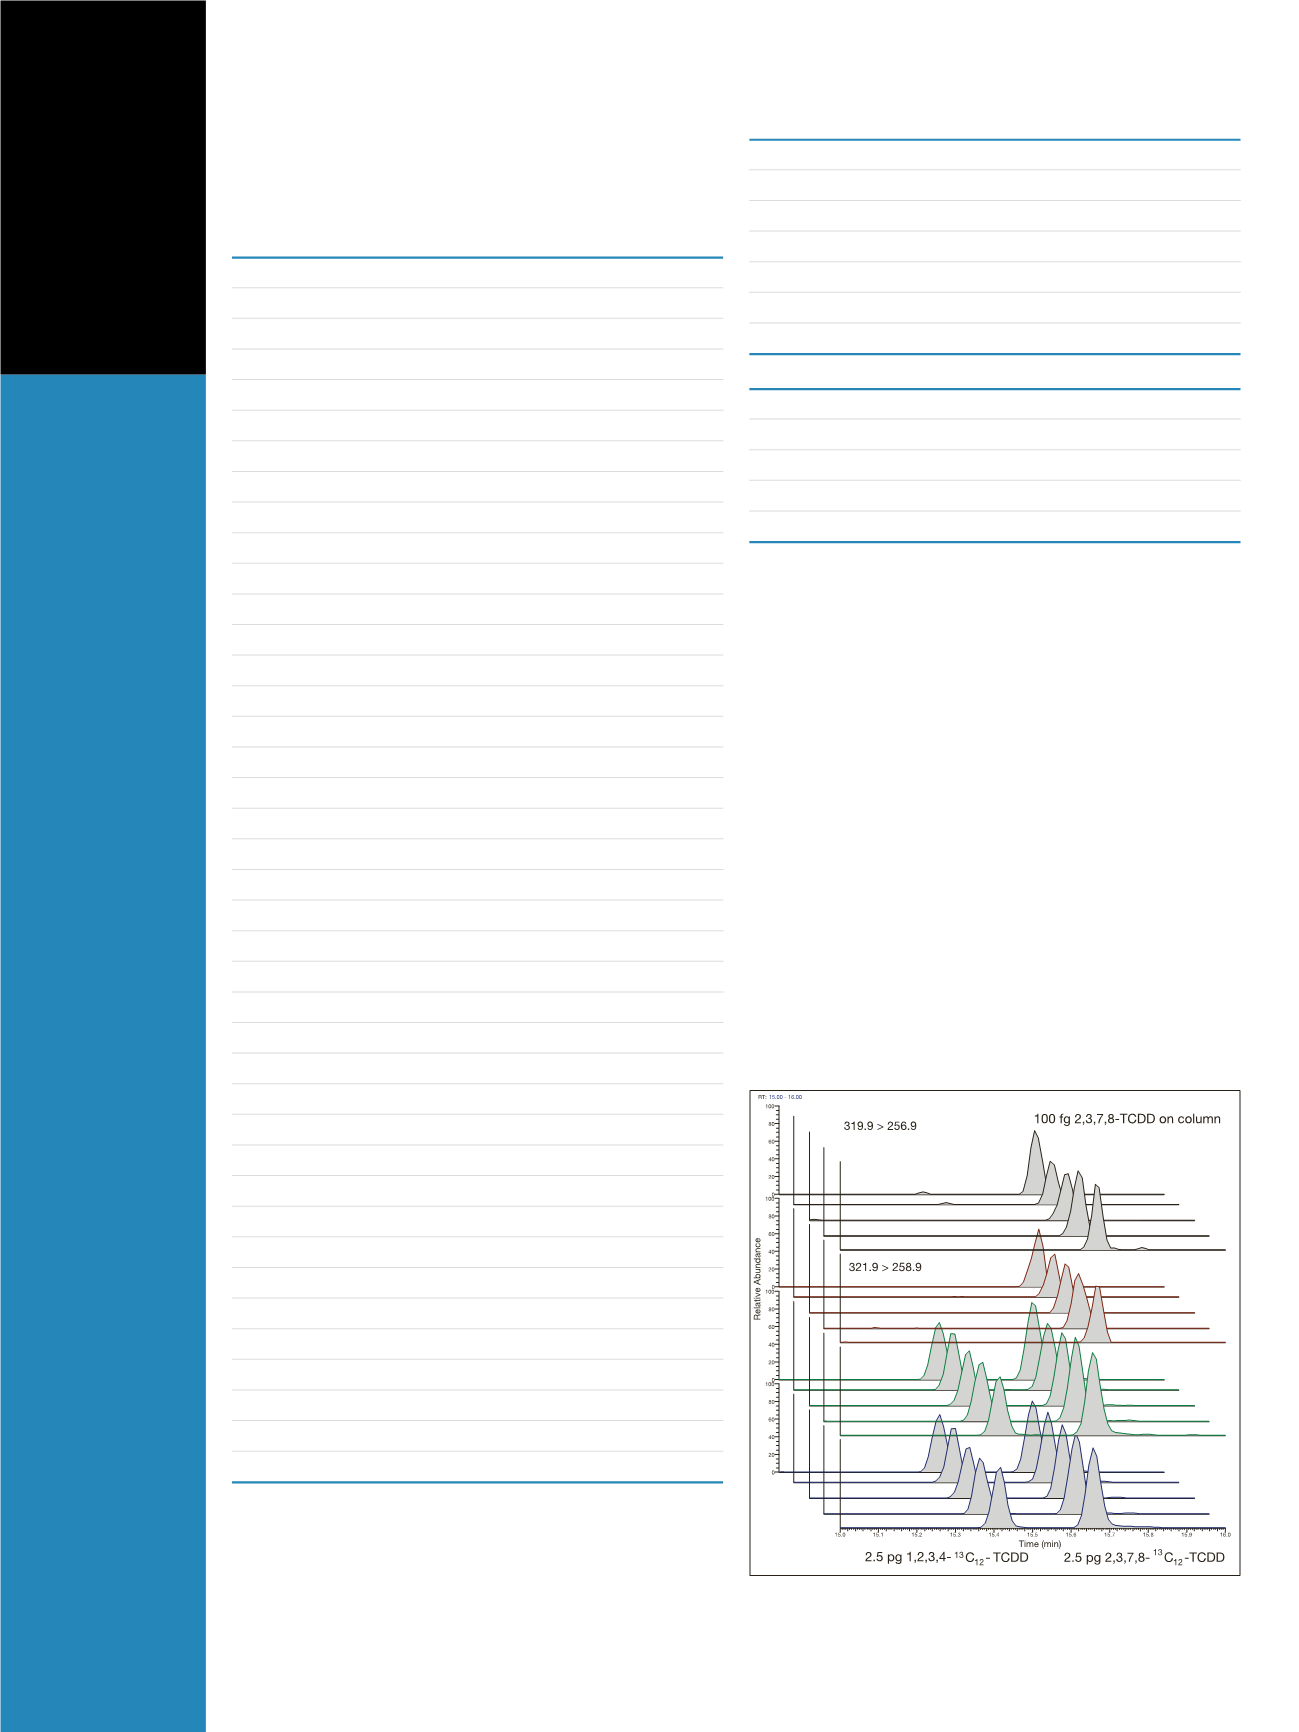
and selectivity. Figure 2 shows an overlay of 2,3,7,8-TCDD
target ions for five injections of a mixed animal fat sample
at 0.13 pg/g fat. The sensitivity and selectivity obtained
was high enough to allow comfortable, precise detection
with all ion ratio integrity maintained. Figure 3 shows
overlay of 1,2,3,7,8-PeCDF (0.4 ng/kg 88% dry weight)
and 2,3,4,7,8-PeCDF (3.4 ng/kg 88% dry weight) for four
injections of grass meal (animal feed) sample. Figure 4
shown native PCDD/Fs SRM chromatograms for the
bottom calibration level for this methodology.
PTV Injection (PCDD/Fs)
Injected Volume
5 µL (toluene)
Injection Speed
5 µL/s
Liner
Open Silcosteel
®
liner (Restek
®
)
Injection Temperature
100 °C
Vent Flow
20 mL/min
Transfer Rate
13.3 °C/s
Final Transfer Temperature
340 °C
GC Programme (PCDD/Fs)
GC Column
DB-5MS (60 m, 0.25 µm, 0.25 mm)
Initial Temperature
120 °C
Rate 1
17 °C/min to 250 °C
Rate 2
2.5 °C/min to 285 °C
Final Temperature
285 °C for 13 min
Table 4: GC and injector conditions
PCDD/F
Precursor
Product
TCDF
303.90
240.94
TCDF
305.90
242.94
13
C TCDF ISTD
315.94
251.97
13
C TCDF ISTD
317.94
253.97
TCDD
319.90
256.90
TCDD
321.89
258.89
13
C TCDD ISTD
331.94
267.97
13
C TCDD ISTD
333.93
269.97
PeCDF
339.86
276.90
PeCDF
341.86
278.89
13
C PeCDF ISTD
351.90
287.93
13
C PeCDF ISTD
353.90
289.93
PeCDD
355.85
292.85
PeCDD
357.85
294.85
13
C PeCDD ISTD
367.90
303.90
13
C PeCDD ISTD
369.89
305.89
HxCDF
371.82
308.86
HxCDF
373.82
310.86
13
C HxCDF ISTD
383.86
319.90
13
C HxCDF ISTD
385.86
321.89
HxCDD
387.82
324.82
HxCDD
389.82
326.82
13
C HxCDD ISTD
399.86
335.86
13
C HxCDD ISTD
401.86
337.86
HpCDF
407.78
344.82
HpCDF
409.78
346.82
13
C HpCDF ISTD
419.82
355.86
13
C HpCDF ISTD
421.82
357.85
HpCDD
423.78
360.78
HpCDD
425.77
362.77
13
C HpCDD ISTD
435.82
371.82
13
C HpCDD ISTD
437.81
373.81
OCDF
441.76
378.80
OCDF
443.76
380.79
13
C OCDF ISTD
453.78
389.82
13
C OCDF ISTD
455.78
391.81
OCDD
457.74
394.74
OCDD
459.74
396.74
13
C OCDD ISTD
469.78
405.78
13
C OCDD ISTD
471.78
407.78
Table 3: Target congener groups SRM transitions
Figure 2: Overlay of 2,3,7,8-TCDD target ions for five injections of a mixed
animal fat sample at 0.13 pg 2,3,7,8-TCDD/g fat. 12% CV was achieved on
the real calculated amount.


