
3
Thermo Scientific Poster Note
•
PN-64152-ASMS-EN-0614S
t of using active flow
y for LC/MS research and
i ll
h
l
Methods
Columns were connected in the manner shown in Figure 2. For the conventional
2.1 mm i.d. column, a 1 mL/min direct flow to source was used with a 2 µL injection
FIGURE 4. A) Comparison of pea
with PCS, conventional 2
.
1 mm i.
%RSD of peak area for six replica
%RSD peak height. Individual co
espec a y w en comp ex
reproducibility, a model
ventional 50 x 4.6 mm i.d.
g a series of standard steroids.
FIGURE 2 Illustrations of column installation The length and inner diameter of
volume to maintain concentration consistency. The conventional 4.6 mm i.d. column
included a 70% post-column split to waste for consistent comparison of sample
introduction to the MS source. All columns were packed with Thermo Scientific™
Accucore™ C18 2.6 µm stationary phase.
A
, %RSD, and %Diff (precision
se flow rates were adjusted to
ere also determined using
ed plasma. Column robustness
a 5 fg/µL alprazolam solution in
.
.
the connective tubing was adjusted to provide similar backpressures (linear
velocities and split flow ratios). A) Conventional 50 x 2.1 mm i.d. column
connected directly to injector and MS source. B) Conventional 50 x 4.6 mm i.d.
column connected directly to injector but including a 70% split to waste post
column C) Curtain flow 50 x 4 6 mm i d column installation Flow split from
he Thermo Scientific™ TSQ
mm i.d. column with a post-
50 x 4.6 mm i.d. column
the CF column over both the
Pump
Injector
HESI
Pump
Injector
HESI
0
μ
m x 70mm
0
μ
m x 70mm
.
.
. .
.
injector to peripheral inlet. Peripheral outlet flow to waste. Central flow zone
from injector to MS source.
A
B
C
e) and conventional 2.1 mm i.d.
precision and accuracy of the
showed increased sensitivity,
2 fg on column. Further
ion following more than 220
NanoViper10
NanoViper10
Waste
HESI
Peripheral
flowtowaste
Injector
Pump
CurtainFlow
Central flow
C
urine.
e for LC/MS separations,
The LC system was a Thermo Scientific™ UltiMate™ 3000 RS system. For curtain
flow column installation, the flow was split immediately prior to the injection valve in the
autosampler. Mobile phase composition for the column performance study was
A: 0.1% formic acid (aq), B: methanol (MeOH) + 0.1% formic acid in a 65:35 ratio
For all test compounds, the curtain f
performance in peak area and peak
performance measurements
lectrospray and atmospheric
e of small-bore HPLC columns
phic efficiency. A study by
formance in a 2.1 mm i.d.
on the reduced plate height,
h
)
isocratically. Gradient elution was used for all other studies with mobile phase A:
2 mM ammonium acetate (NH
4
OAc) (aq) and B: acetonitrile (ACN) (sensitivity and
linearity) and 2 mM NH
4
OAc (aq) and B: MeOH + 2 mM NH
4
OAc (urine study). Flow
rates were measured volumetrically to determine the actual flow entering the MS
source (with the exception of the 2
.
1 mm i.d. column). Samples were analyzed by
.
Calibration curves were generated
from 1 pg/µL to 100 pg/µL. RSD%
Figure 5 shows the CF 4.6 mm i.d.
conventional 4 6 mm i d column wit
ters of 1.7 to 2.7 µm was
mn length, and manufacturer.
ty in LC/MS research and
bility of the column, which is
us. One approach to remove
t d h
t i
Results
selected-reaction monitoring (SRM) with a TSQ Quantiva MS in heated-electrospray
ionization (HESI) mode
.
. .
Table 1 lists RSD% on the lowest co
column provides better reproducibili
the conventional 4.6 mm i.d. or the
s presen e ere uses cur a n
e phase is managed at both the
inside the analytical column
iameter; the dimensions are
through the central zone
n active flow management
Column Performance
Column performance was measured using a mixture of steroids – ketotestosterone,
nortestosterone, testosterone and epitestosterone – in concentrations from 1 to
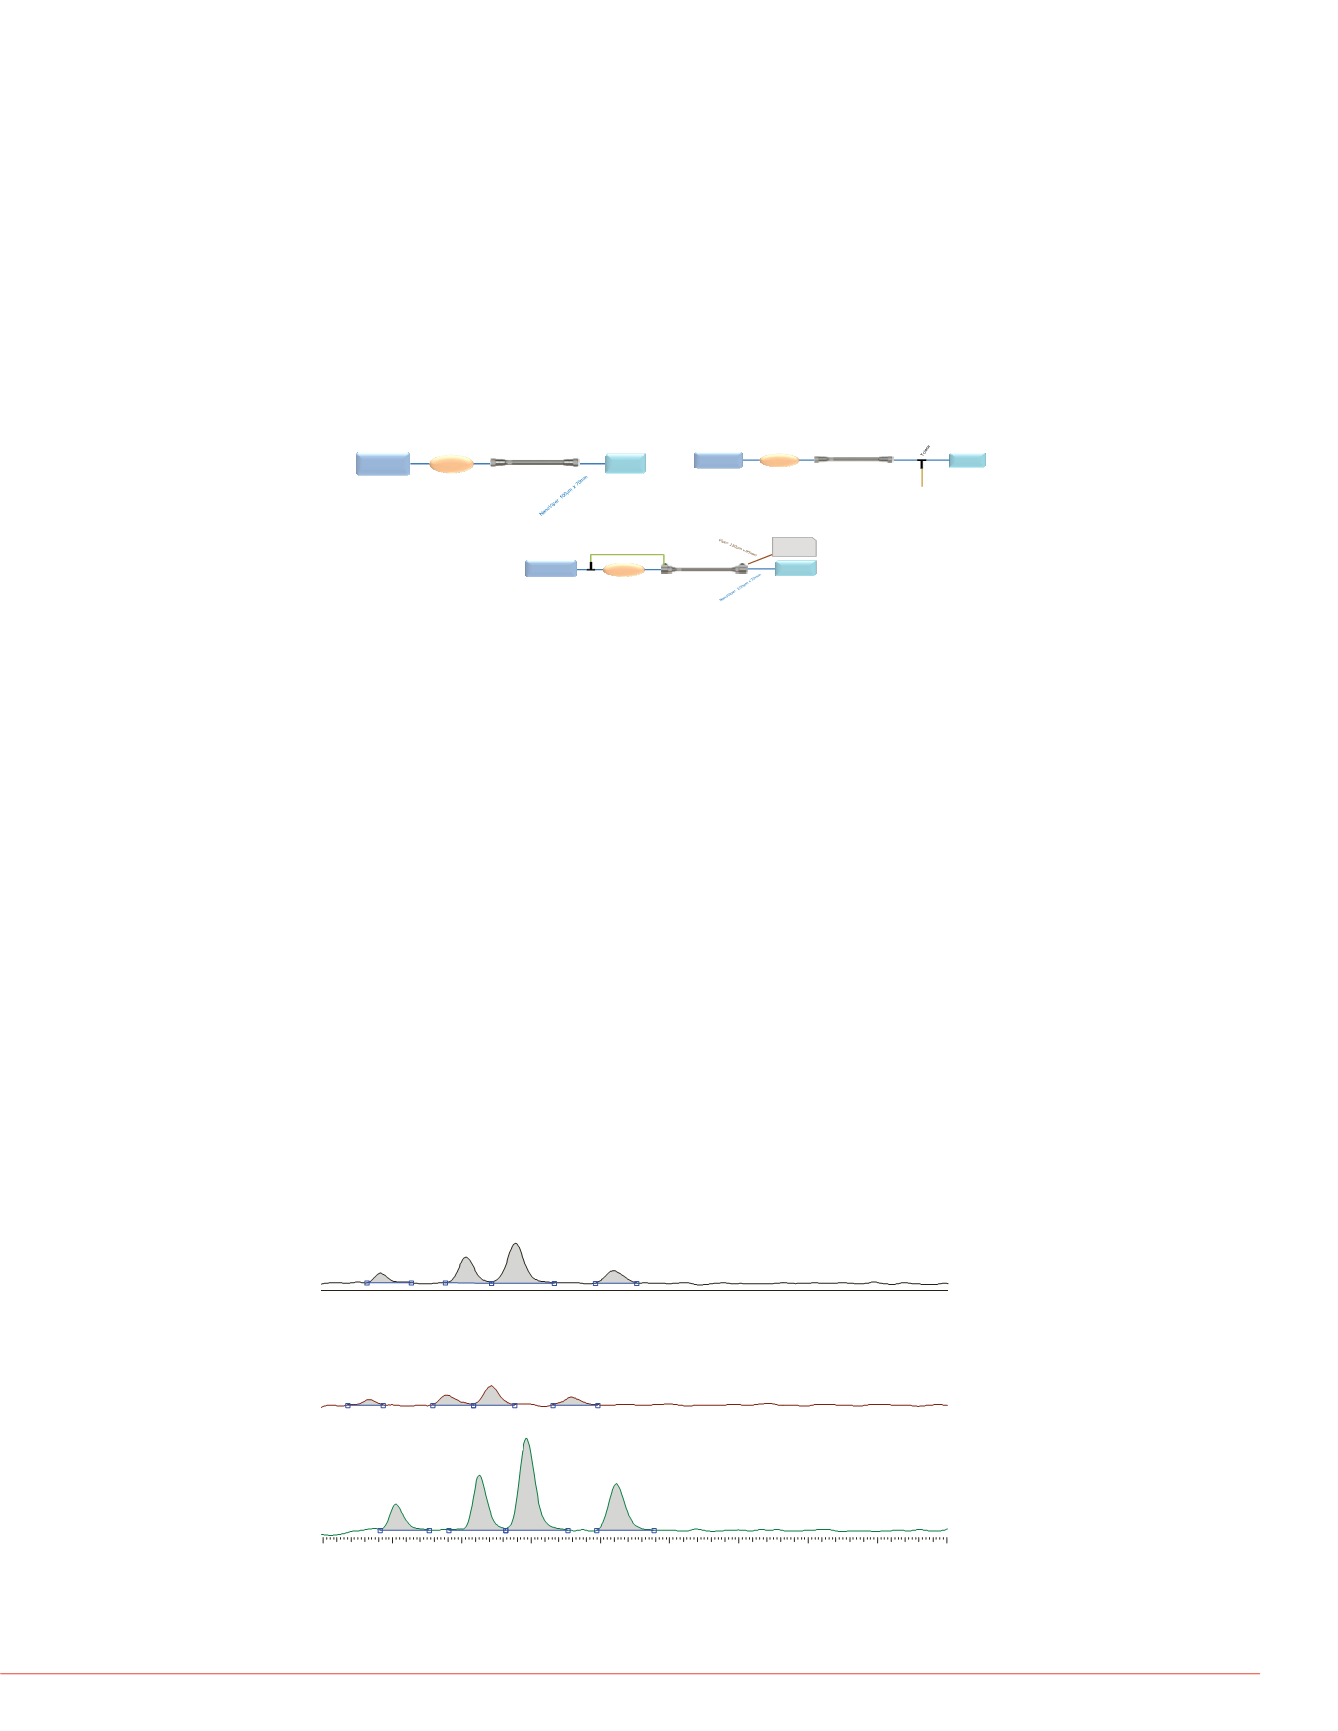
100 pg/µL with six replicate injections per sample. Figure 3 shows the TIC
chromatograms of the test compounds (1 pg/µL) The mean of the performance
FIGURE 5. Calibration curves for
A) conventional 4.6 mm i.d. colu
column, and C) CF 4.6 mm i.d. col
A
eter (4.6 mm) adds an
ng larger injection volumes)
.
e phase is split prior to the
.
parameters of peak area, height, S/N, and RSD% (area and height) were graphed and
compared. Figure 4 shows peak area comparison (A) and area RSD% (B), peak
height comparison (C), and %RSD for peak height
FIGURE 3. TIC Chromatograms (SRM) of ketotestosterone, nortestosterone,
t t t
d it t t
A) C ti
l 4 6 i d l
ith
11-ketotestosterone
Y= -559.255+3.12757e+006*X R^2=0.9988 W:1/X
150000
200000
250000
300000
Area
w region. Mobile phase flow
olumn. Virtual column
entral flow region and the
es os erone an ep es os erone on onven ona . mm . . co umn w
PCS, B) Conventional 2
.
1 mm i.d. column and C) CF 4.6 mm i.d. column.
Intensity was normalized to most intense base peak.
G
RT:0.38
AA 4275
NL:
6.00E3
TIC MS
Genesis
S1-6
0.00
0.02
0.04
0.06
0.08
0
50000
100000
A
Central flow
:
RT:0.31
AA:2484
RT:0.52
AA:1345
RT:0.18
AA:801
NL:
6.00E3
TIC MS
Genesis s1-6
Y= -1
400000
500000
600000
700000
800000
Area
C
B
to source
RT:0.34
AA:1835
RT:0.28
AA:999
RT:0.46
AA:802
RT:0.16
AA:429
RT:0.39
AA:9012
NL:
6.00E3
TIC MS
Genesis s1 6
0
20
0
100000
200000
300000
C
0.1
0.2
0.3
0.4
0.5
0.6
0.7
0.8
0.9
1.0
RT:0.33
AA:4876
RT:0.52
AA:4760
RT:0.20
AA:2358
-
Time (min)


