
4
Full Optimization of LC/MS Methods to Increase Robustness of Complicated Matrix Containing Samples Using Active Flow Management Chromatography
TABLE 1. %RSD (precision
(Cmpd 1), nortestosterone
(Cmpd 4) analyzed on a co
2
.
1 mm i.d. column, and a
Figure 2. For the conventional
rce was used with a 2 µL injection
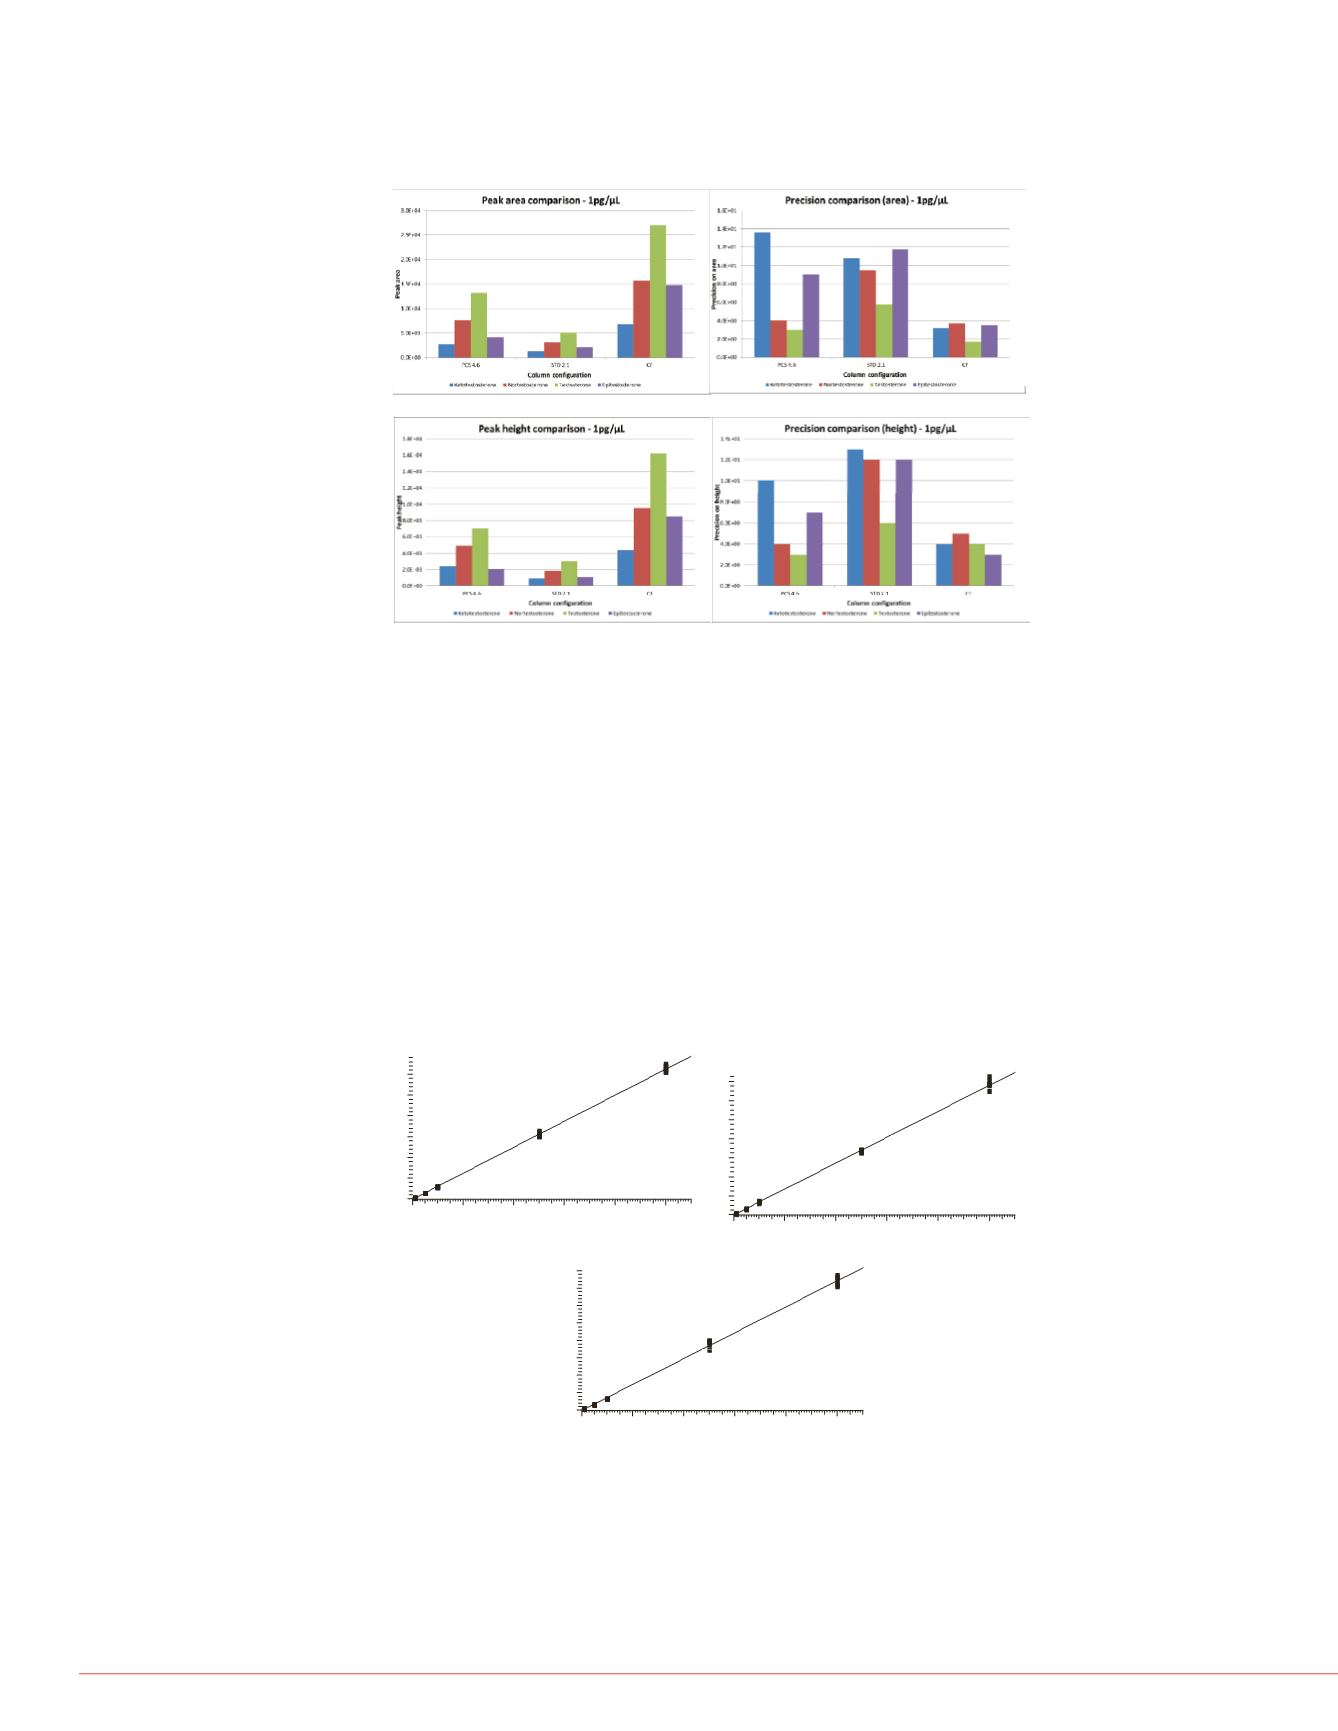
FIGURE 4. A) Comparison of peak areas for conventional 4.6 mm i.d. column
with PCS, conventional 2
.
1 mm i.d. column, and CF 4.6 mm i.d. column. B)
%RSD of peak area for six replicate injections. C) Peak height comparison. D)
%RSD peak height. Individual components are coded in the graph legend.
Column
4.6 mm PCS
2 1 mm
The length and inner diameter of
e conventional 4.6 mm i.d. column
sistent comparison of sample
packed with Thermo Scientific™
A
B
.
4.6 mm CF
.
e similar backpressures (linear
nal 50 x 2.1 mm i.d. column
B) Conventional 50 x 4.6 mm i.d.
uding a 70% split to waste post
mn installation Flow split from
A sensitivity study was also
a calibration curve for alpraz
Pump
Injector
HESI
0
μ
m x 70mm
0
μ
m x 70mm
.
ow to waste. Central flow zone
B
D
C
plasma (30% ACN added to
analyzed in three replicates
B = ACN) using the gradient
3 mL/min, which resulted in
using a TSQ Quantiva MS b
NanoViper10
NanoViper10
Waste
HESI
Peripheral
flowtowaste
m/z
311 → 283 (Cl37) with 3
2.5 mTorr. A calibration curv
Figure 6. Both alprazolam (
(311 → 283) were monitored
LOQ of 6 fg on column with
TABLE 2. Gradient elution
te™ 3000 RS system. For curtain
iately prior to the injection valve in the
olumn performance study was
0.1% formic acid in a 65:35 ratio
For all test compounds, the curtain flow 4.6 mm i.d. column showed increased
performance in peak area and peak height, as well as an increase in precision of those
performance measurements
chromatograms at both LOQ
column.
Time (min)
% Mobil
0
0.2
2
er studies with mobile phase A:
acetonitrile (ACN) (sensitivity and
2 mM NH
4
OAc (urine study). Flow
the actual flow entering the MS
mn). Samples were analyzed by
.
Calibration curves were generated on the performance test mixture at concentrations
from 1 pg/µL to 100 pg/µL. RSD% were calculated using six replicate injections.
Figure 5 shows the CF 4.6 mm i.d. column maintains excellent linearity compared to a
conventional 4 6 mm i d column with PCS and a conventional 2 1 mm i d column
2.01
2.5
2.51
uantiva MS in heated-electrospray
.
. .
.
. .
.
Table 1 lists RSD% on the lowest concentration sample (1 pg/µL). The CF 4.6 mm i.d.
column provides better reproducibility at the lower concentration samples then either
the conventional 4.6 mm i.d. or the 2.1 mm i.d. column.
ture of steroids – ketotestosterone,
e – in concentrations from 1 to
. Figure 3 shows the TIC
The mean of the performance
FIGURE 5. Calibration curves for 11-ketotestosterone generated on
A) conventional 4.6 mm i.d. column with PCS, B) conventional 2.1 mm i.d.
column, and C) CF 4.6 mm i.d. column
3
FIGURE 6 C lib ti
A
B
(area and height) were graphed and
n (A) and area RSD% (B), peak
t
. a ra on curv
Top - alprazolam; bottom -
testosterone, nortestosterone,
ti
l 4 6 i d l
ith
11-ketotestosterone
Y= -559.255+3.12757e+006*X R^2=0.9988 W:1/X
150000
200000
250000
300000
Area
11-ketotestosterone
Y= -186.13+1.36028e+006*X R^2=0.9984 W:1/X
100000
120000
140000
a
Y
120000
n ona . mm . . co umn w
C) CF 4.6 mm i.d. column.
e peak.
NL:
6.00E3
TIC MS
Genesis
S1-6
0.00
0.02
0.04
0.06
0.08
0.10
0
50000
100000
0.00
0.02
0.04
0.06
0.08
0.10
0
20000
40000
60000
80000
Are
40000
60000
80000
100000
Area
NL:
6.00E3
TIC MS
Genesis s1-6
11-Ketotestosterone
Y= -1942.93+7456.49*X R^2=0.9966 W:1/X
400000
500000
600000
700000
800000
Area
C
0
0
20000
45000
NL:
6.00E3
TIC MS
Genesis s1 6
0
20
40
60
80
100
pg/uL
0
100000
200000
300000
15000
20000
25000
30000
35000
40000
Area
0.7
0.8
0.9
1.0
-
0
0
5000
10000


