
5
Thermo Scientific Poster Note
•
PN-64152-ASMS-EN-0614S
TABLE 1. %RSD (precision) for 1 pg/µL (6 replicates) sample of 11-ketotestosterone
(Cmpd 1), nortestosterone (Cmpd 2), testosterone (Cmpd 3) and epitestosterone
(Cmpd 4) analyzed on a conventional 4.6 mm i.d. column with PCS, a conventional
2
.
1 mm i.d. column, and a curtain flow 4.6 mm i.d. column
tional 4.6 mm i.d. column
4.6 mm i.d. column. B)
eak height comparison. D)
d in the graph legend.
Concentration
Al
TABLE 4. RSD% for alprazolam.
samples and reported as not det
Column
Cmpd 1 Cmpd 2 Cmpd 3 Cmpd 4
4.6 mm PCS
13.58
4.17
2.76
7.01
2 1 mm
10 79
9 54
5 73
11 79
B
(fg on column)
2
6
60
.
.
.
.
.
4.6 mm CF
3.2
3.67
1.75
3.48
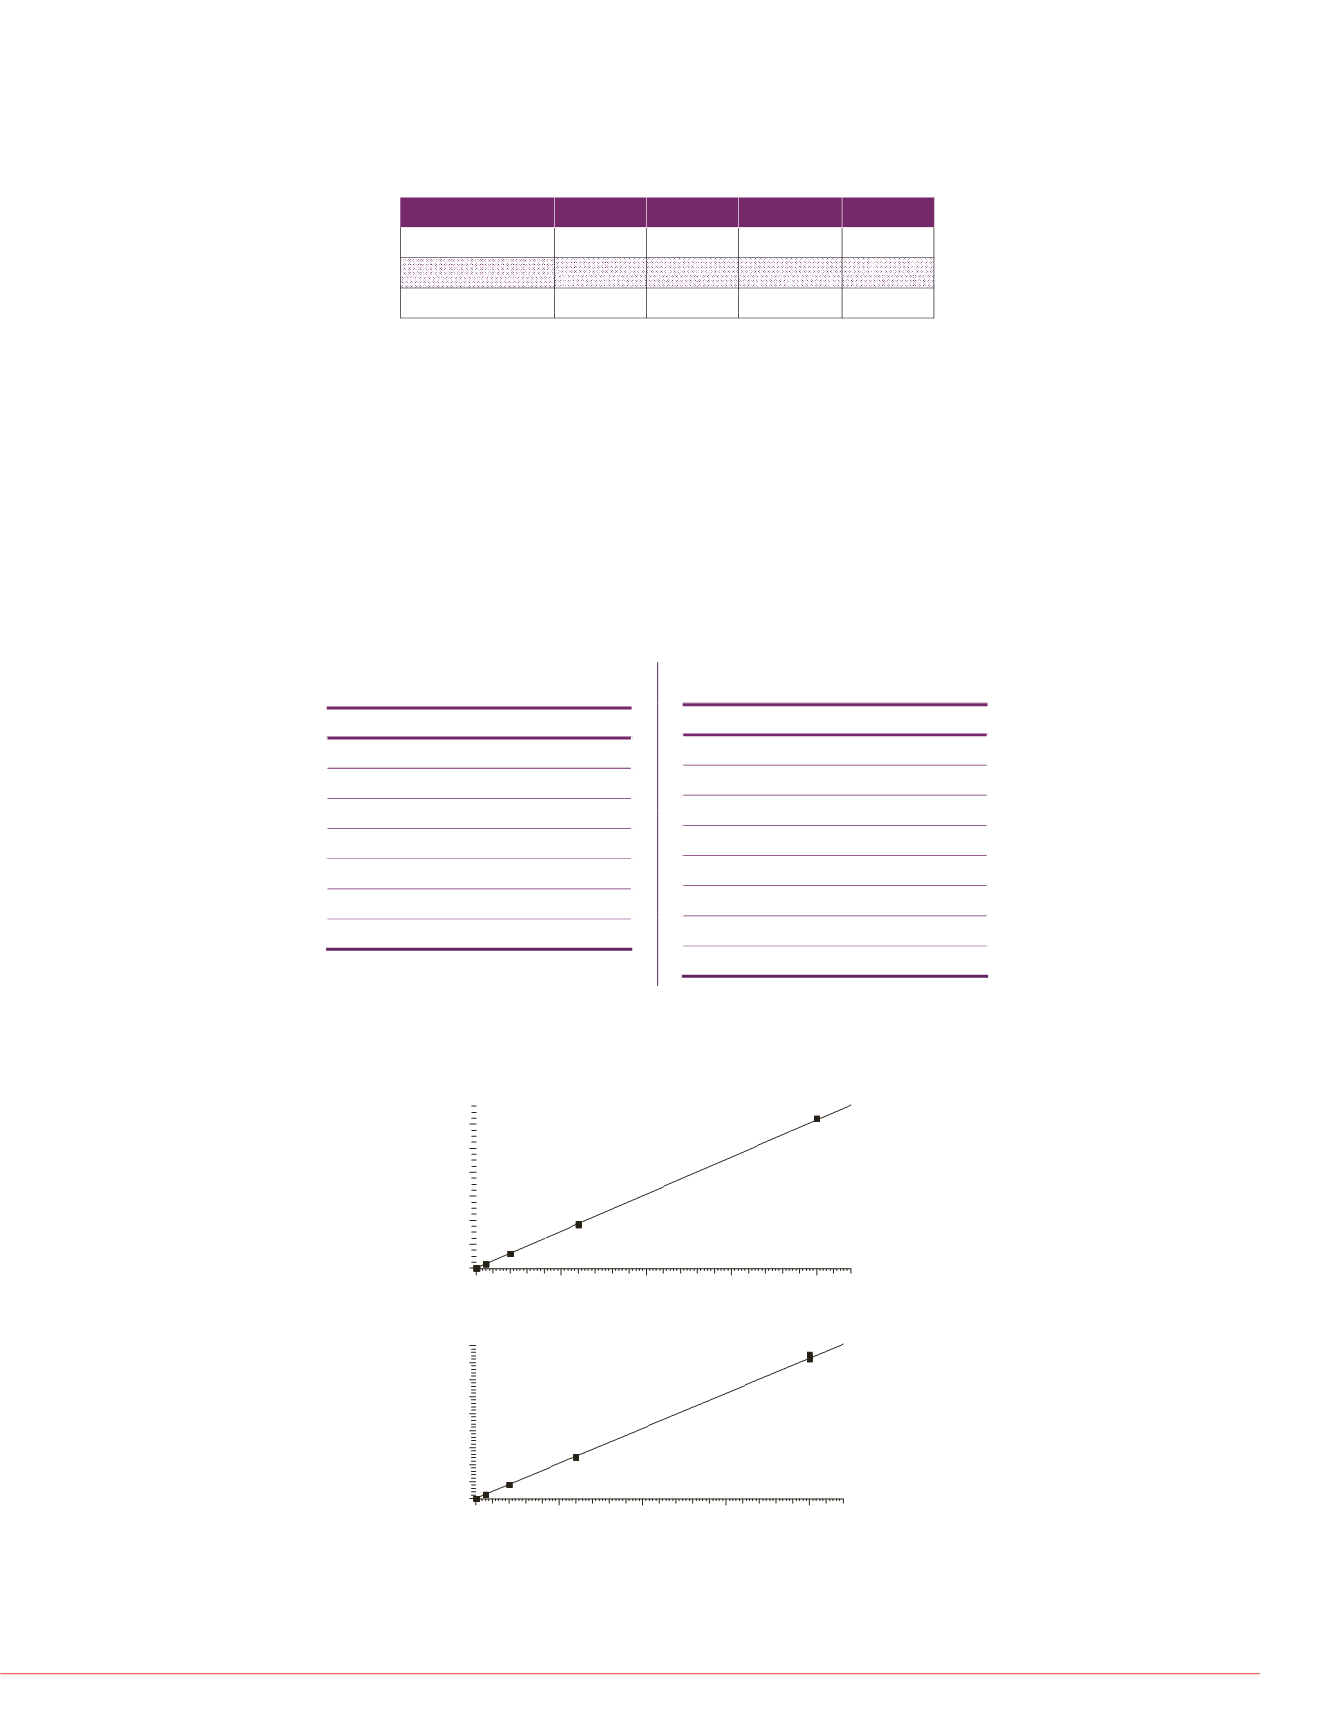
A sensitivity study was also performed using the CF 4.6 mm i.d. column by generating
a calibration curve for alprazolam from 2 fg to 2000 fg on column in 30% crashed
200
600
2000
D
plasma (30% ACN added to plasma and centrifuged to remove solids). Samples were
analyzed in three replicates by gradient elution (mobile phase A = 2 mM NH
4
OAc (aq),
B = ACN) using the gradient conditions in Table 2. The pump flow rate setting was
3 mL/min, which resulted in a central zone flow of 900 µL/min. Samples were detected
using a TSQ Quantiva MS by SRM (+) monitoring two transitions
m/z
309 → 281 and
c:\xcalibur\...\alp-neat-1_140525140355
05/25/1414:03:55
Blank
FIGURE 7. TIC chromatograms o
chromatography. Also shown ar
on column showing excellent re
,
,
m/z
311 → 283 (Cl37) with 30 V collision energy and collision gas pressure of
2.5 mTorr. A calibration curve was generated with 1/x weighting and is shown in
Figure 6. Both alprazolam (309 → 281) and the naturally occurring
37
Cl parent ion
(311 → 283) were monitored and both show excellent linearity. %RSD indicates an
LOQ of 6 fg on column with an LOD of 2 fg on column. Figure 7 shows TIC
RT:
0.11 -1.08
SM:
7G
40
60
80
100
e Abundance
0
20
40
60
80
100
Relative Abundance
0.91
0.46
0.51
0.63
0.57
0.98
0.68
0.42
0.72
1.
0.23
0.78
0.26
0.33 0.36
0.19
0.82
RT:0.50
AA:404
Blank
LOQ
6 fg on column
TABLE 2. Gradient elution conditions
umn showed increased
n increase in precision of those
chromatograms at both LOQs and peak shape reproducibility at the LOQ of 6 fg on
column.
TABLE 3. MS Acquisition conditions
0.2
0.3
0.4
0.5
0.6
0.7
0.8
0.9
1.0
Time (min)
0
20
40
60
80
100
Relative Abundance
0
20
Relativ
RT:0.50
AA:169
LOD
2 fg on column
Time (min)
% Mobile Phase B
0
40
0.2
40
2
70
test mixture at concentrations
g six replicate injections.
cellent linearity compared to a
ntional 2 1 mm i d column
Source Conditions
Ionization
HESI +
Source Voltage 600 V
Cap Temp
350 °C
To determine column robustness, 1
injected and peak areas were repo
various stages of this analysis.
FIGURE 8. TIC chromatograms o
2.01
90
2.5
90
2.51
40
.
. .
.
(1 pg/µL). The CF 4.6 mm i.d.
entration samples then either
Vap Temp
450 °C
Q1 FWHM 0.7
Q3 FWHM 0.7
alprazolam-stab-sweep-160
06/0
10 fg/uLalprazolam insyntheticurine
RT:
0.20 - 0.70
0
20
40
60
80
100
RT: 0.42
AA: 960
RT: 041
N
TI
m
[2
G
al
10
N
alprazolam in 1:1 v/v synthetic u
10 inj
e generated on
nventional 2.1 mm i.d.
3
40
FIGURE 6 C lib ti
f l
l
i
h d l
B
Cycle Time
0.3 min
Chrom Filter
3 s
0
20
40
60
80
100
0
20
40
60
80
100
RelativeAbundance
.
AA: 879
RT: 0.41
AA: 883
RT: 0.42
AA: 1006
TI
m
[2
G
al
50
N
TI
m
[2
G
al
10
N
TI
50 inj
100 inj
Conclusion
C t i fl
h t
h
. a ra on curves o a prazo am n cras e p asma.
Top - alprazolam; bottom - alprazolam –
37
Cl (naturally occurring)
11-ketotestosterone
6.13+1.36028e+006*X R^2=0.9984 W:1/X
Alprazolam
Y= -14.5137+61.7744*X R^2 = 0.9996 W: 1/X
120000
0.2
0.3
0.4
0.5
0.6
0.7
Time (min)
0
20
40
60
80
100
m
[2
G
al
15
150 inj
ur a n ow c roma ograp y
and robustness over small-b
lead to decreased column p
Curtain flow chromatography
methods especially where la
0.04
0.06
0.08
0.10
40000
60000
80000
100000
Area
contain complex matrices.
Future work requires reducin
virtual column inner diamete
consumption. This can pote
micro-bore columns are mor
0
500
1000
1500
2000
fg onColumn
0
20000
Alprazolam-Cl37
Y= 38.6136+20.6357*X R^2 = 0.9990 W: 1/X
45000
columns.
References
1 F Gritti G Guiochon
J
100
15000
20000
25000
30000
35000
40000
Area
.
.
, .
,
.
2. R.A. Shalliker, M. Camen
1262 (2012) 64 AN64053.
0
500
1000
1500
2000
fg onColumn
0
5000
10000
All trademarks are the property of Thermo Fis
encourage use of these products in any mann


