
6
Multiplexing Multiple Methods to Maximize Workflow Efficiency in LC-MS Laboratories
min
d
ve
rge
hputs
Multi-channeling batches of Bup/Norbub and EtG/EtS
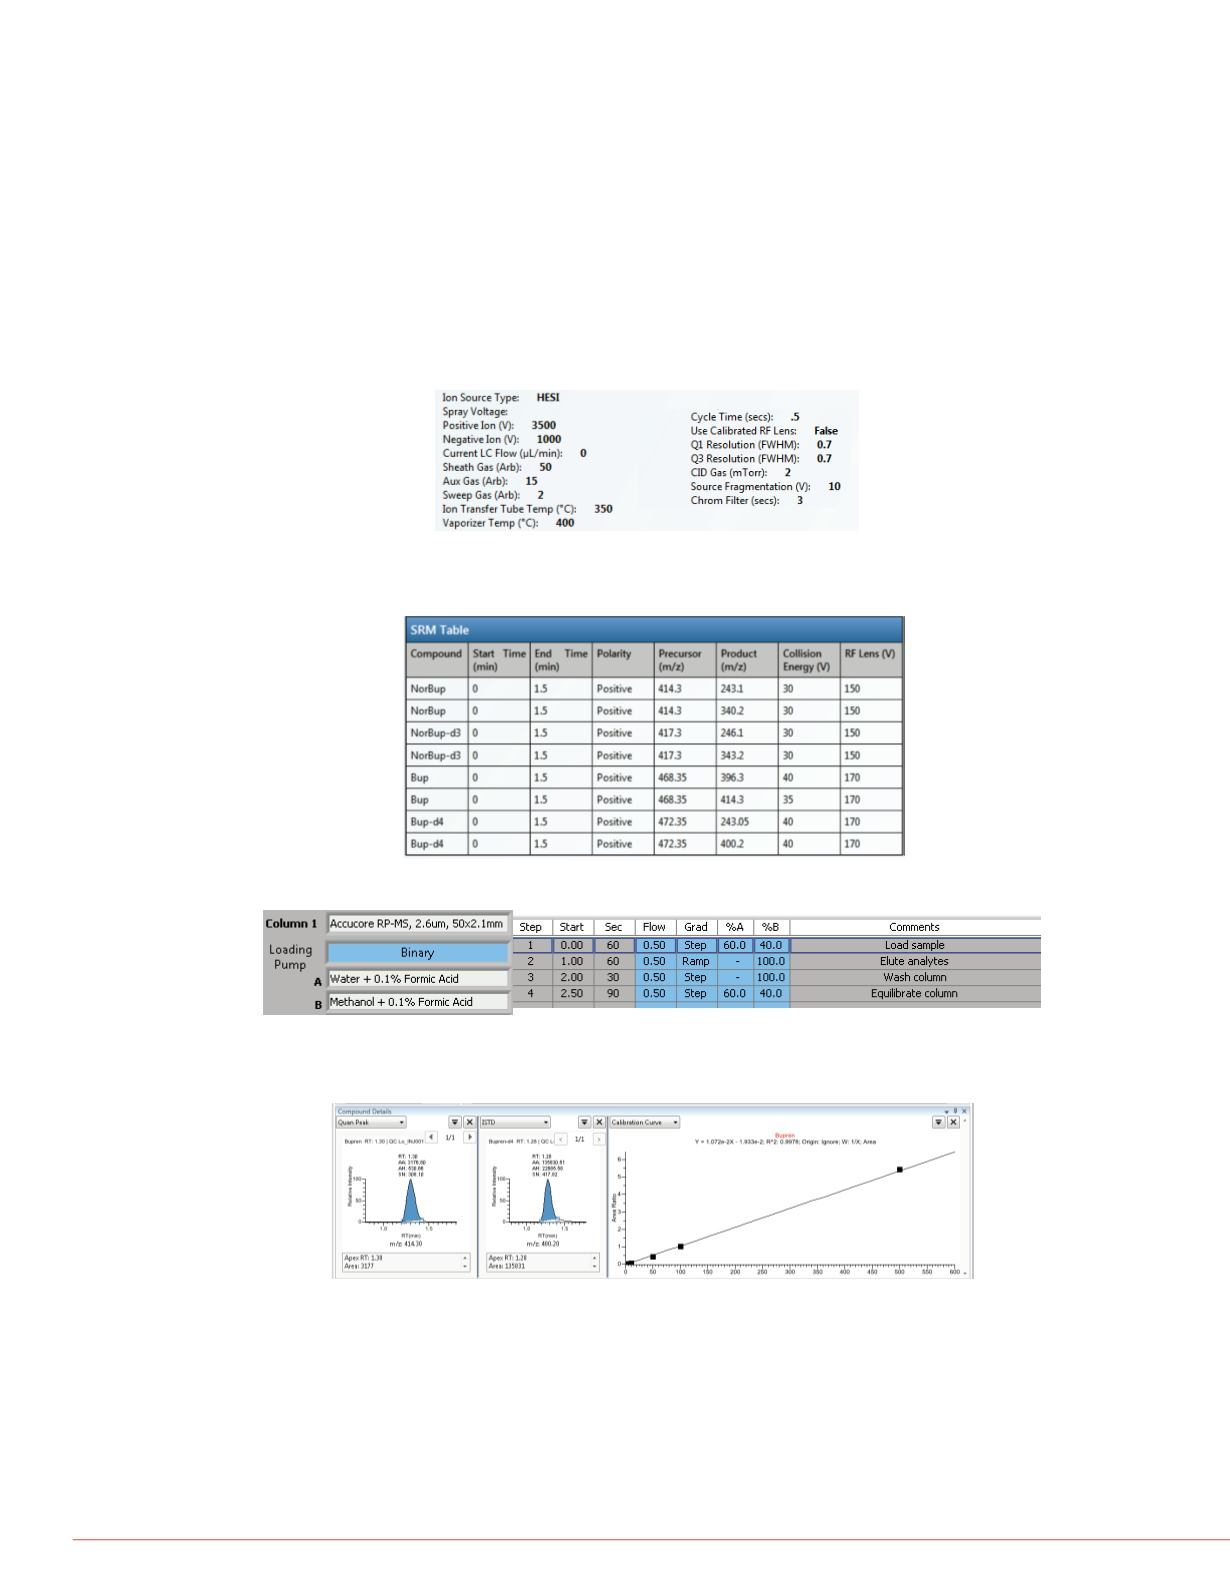
FIGURE 7. Common HESI Source Conditions
FIGURE 8. MS/MS & LC Conditions for Bup/Norbup
Start data 0.5 min
Data window: 1.5 min
Total run time: 4.0 min
FIGURE 9. Typical results for Bup/NorBup
Desired quantitation range from 5 to 500 ng/mL achieved.
FIGURE 10. MS/MS & LC Conditions for EtG/EtS
Ack
We th
Park,
on de
mass
s with MMA
/EtS
with the
re was used
ms, submit
and
injections of 25-OH-VitDs are completed in one hour.
Internal standard peak areas among blood serum specimens varied
greatly due to ion suppression by co-eluting interferences or by
sample matrix components that interfere with the butylation reaction.
The cause(s) of this variability is being investigated. However, the
calculated amounts of MMA concentrations in the QCs and specimens
measured agreed with theoretical values within +/- 15%.
All trad
This inf
that mi


