
7
Thermo Scientific Poster Note
•
PN64229-MSACL-EN 0814S
Conclusion
This off-line automated data processing tool shows a good agreement
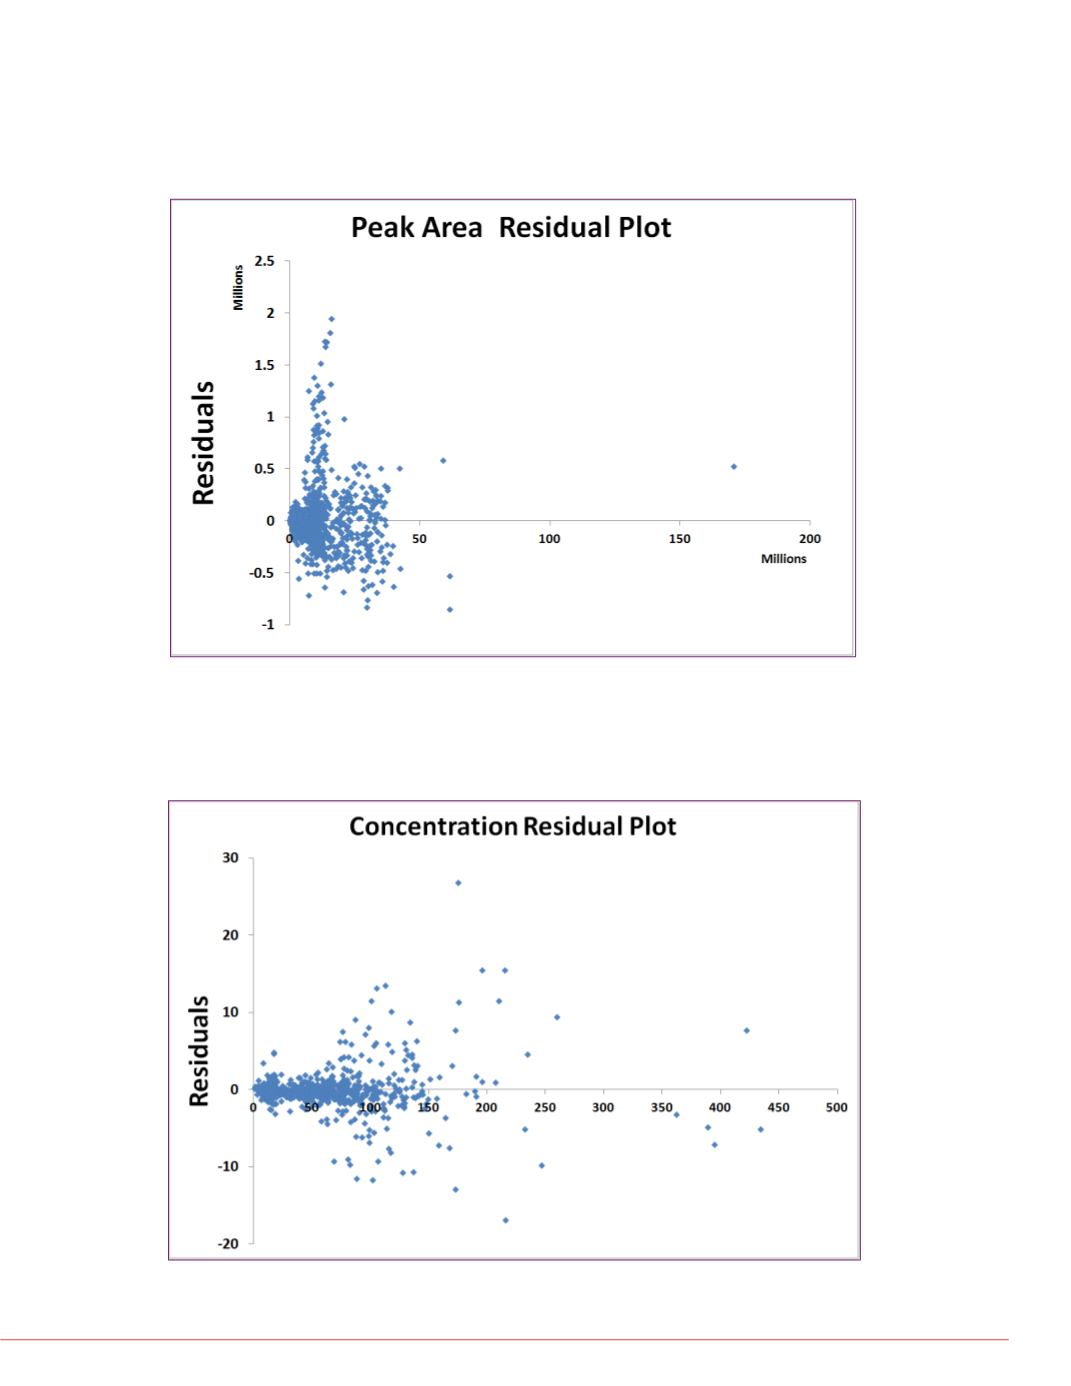
FIGURE 5. Residual plot of 1000 calculations of analyte
concentrations from 100 donor Samples
FIGURE 4. Residual plot of 1900 calculations of analyte peak
area from 100 donor Samples
d
S
ntered
ing
;
ples;
The
alyte
layed
t.
nd
nual
nual
Figures 4 and 5 show additional statistics for the comparison.


