
6
The Use of A New Meta-calculation Software for Automated Data Processing of Tandem MS for Inborn Error Metabolism Research
Refer
1. Millin
1990;
2. Robe
Ackn
Author Aff
1. Therm
2. Therm
3. Therm
4. Medic
MSACL
Results
Over 96% of calculations of analyte peak area and concentration
(Analytes and Formulas) are within 10% of bias. Over 82% of
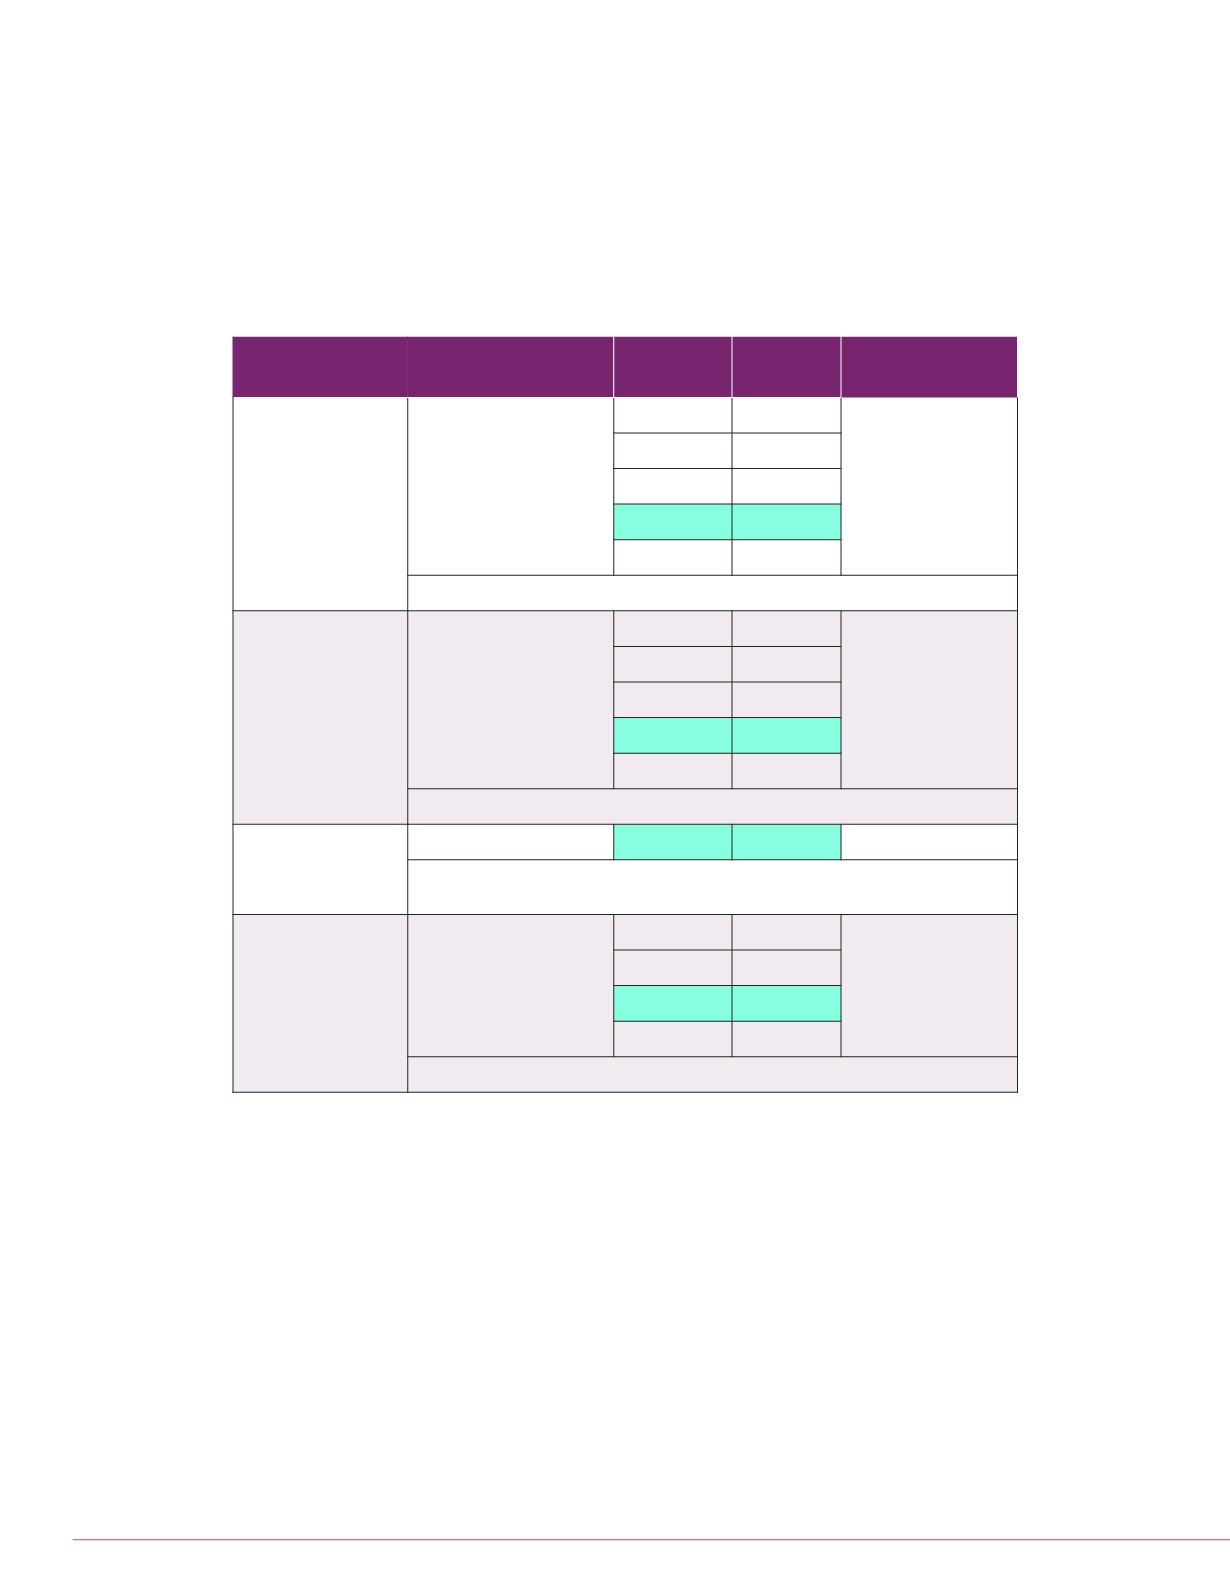
Formulas Ratios are within 10% of bias. Table 2 below shows
comparison between software calculations and manual calculations.
iRC PRO
registere
and other
Fisher Sc
This infor
any mann
others
.
For resea
Product
(m/z)
85.00
85.00
85.00
85.00
85.00
85.00
85.00
85.00
85.00
Italy)
ftware
MS.
reating
peak
ibur™
d copied
e
by the
tines
Type
Analyte/
Formula
Number
(N)
Bias% Value Range
Analyte
Peak Area
19 Analytes
1,900
< 48%
17,400
–
174,827,146
1898
< 30%
1894
< 20%
1842
< 10%
1672
< 5%
R2 = 0.999438 Y =
-
7879 + 0.999719X
Analyte
Concentration
Cit, Met, Orn,
Phe, Tyr, C0, C8,
C14, C14:1, C16
1,000
< 45%
0.62
–
431.51
998
< 30%
993
< 20%
958
< 10%
845
< 5%
R2 = 0.997733 Y =
-
0.19774 + 0.998866X
Formula
Concentration
(User Defined)
F1=C0+C14:1
100
< 5% 20.83
–
386.55
R2 = 0.999544 Y = 0.174589 + 0.999772X
Formula
Peak Area
(User Defined)
F2=(Orn-Phe)/Tyr
F3=(C8+C14:1-
C16)/(Orn+Tyr)
200
< 30%
-1.4403
–
3.534176
192
< 20%
165
< 10%
113
< 5%
R2 = 0.991617 Y = 0.004626 + 0.995799X
TABLE 2. Comparison between software and manual calculations


