
5
Thermo Scientific Poster Note
•
PN64229-MSACL-EN 0814S
Concl
This off-lin
with the m
concentrati
This meta
effectivene
removing tr
processing
Refere
1. Millingt
1990;1
2. Robert
Ackno
Author Affili
1. Thermo
2. Thermo
3. Thermo
4. Medical
MSACL E
Results
Over 96% of calculations of analyte peak area and concentration
(Analytes and Formulas) are within 10% of bias. Over 82% of
Formulas Ratios are within 10% of bias. Table 2 below shows
comparison between software calculations and manual calculations.
iRC PRO i
registered t
and other c
Fisher Scie
This inform
any manne
roduct
(m/z)
85.00
85.00
85.00
85.00
85.00
85.00
85.00
85.00
85.00
taly)
tware
S.
nes
Type
Analyte/
Formula
Number
(N)
Bias% Value Range
Analyte
Peak Area
19 Analytes
1,900
< 48%
17,400
–
174,827,146
1898
< 30%
1894
< 20%
1842
< 10%
1672
< 5%
R2 = 0.999438 Y =
-
7879 + 0.999719X
Analyte
Concentration
Cit, Met, Orn,
Phe, Tyr, C0, C8,
C14, C14:1, C16
1,000
< 45%
0.62
–
431.51
998
< 30%
993
< 20%
958
< 10%
845
< 5%
R2 = 0.997733 Y =
-
0.19774 + 0.998866X
Formula
F1=C0+C14:1
100
< 5% 20.83
–
386.55
TABLE 2. Comparison between software and manual calculations
nal
tracted
MS
h.
roviding
isher
The
g for the
in this
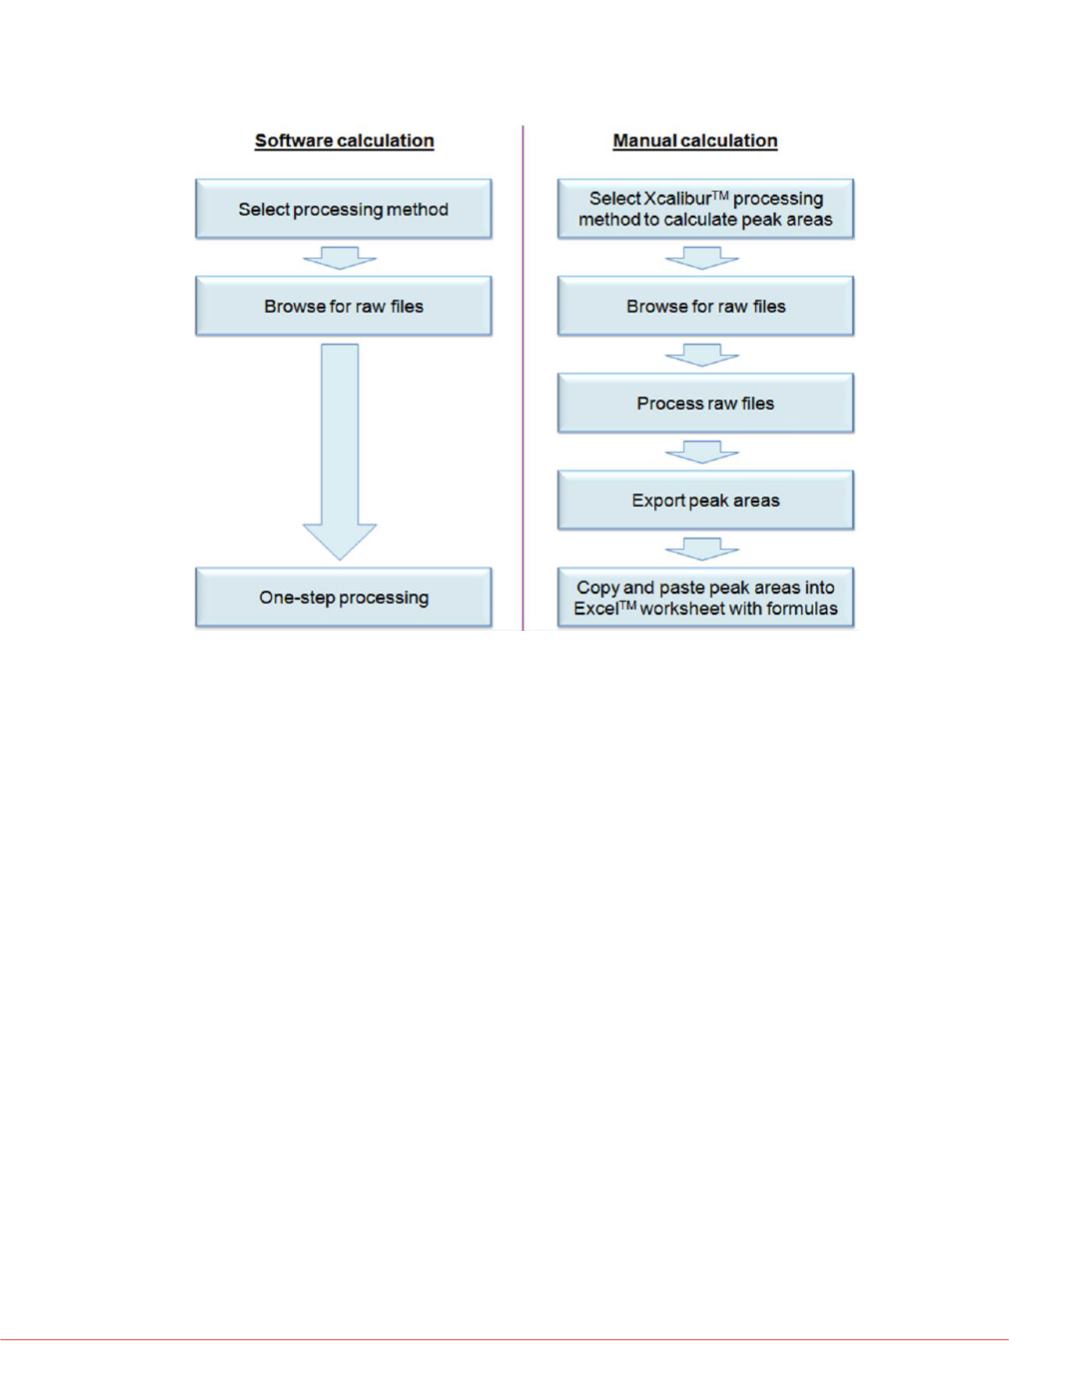
FIGURE 3. Workflow Comparison between Software and Manual
Approach


