
4
The Use of A New Meta-calculation Software for Automated Data Processing of Tandem MS for Inborn Error Metabolism Research
hase of
is.
process
lysis of
s were
ltiple-
as, 1,000
greement
from hours
h started
gy, more
ample
nal
of
ure 1).
Research
Claudio De Nardi
2
, Marta Kozak
1
,
tz
3
, David C. Kasper
4
, Chengya Liang
1
FIGURE
concent
FIGURE
area fro
Software Calculation:
The SRM transitions for each analyte and
internal standard are entered in the software for data analysis; IS
concentration and analyte/IS relative response factor are also entered
to calculate analyte concentration.
User defined formulas can be created to perform calculations using
peak areas or analyte concentrations.
Upper and lower concentration limits can be set for each analyte;
different values can be used for unknown and quality control samples;
the software will flag samples outside these acceptance ranges. The
same applies to user defined formulas.
A processing method is created by selecting the peak areas, analyte
concentrations and user defined formula results that will be displayed
by the software. Results can be exported in Excel or text format.
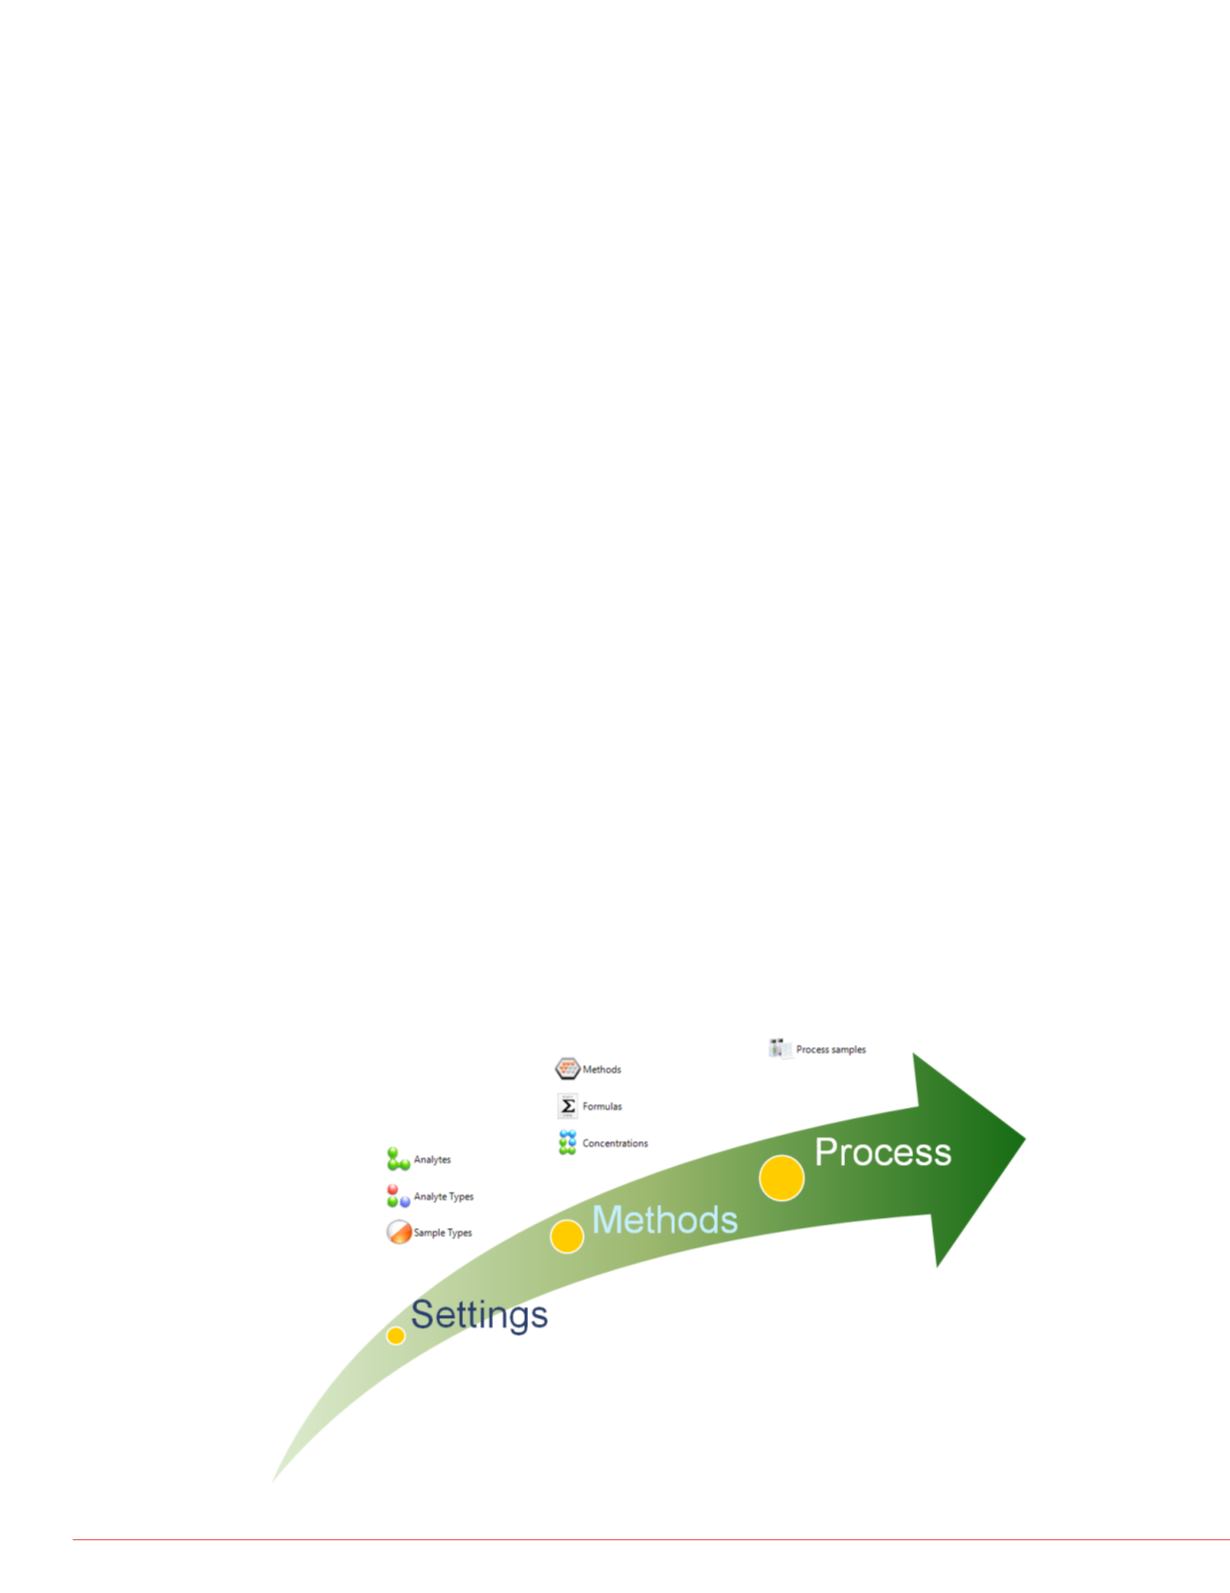
As depicted below, Figures 2 shows the workflow of software, and
Figure 3 shows workflow comparison between software and manual
process.
FIGURE 2. Intuitive Workflow – icon based User Interface
sting
FIGURE 3. Workflow Comparison between Software and Manual
Approach
Figures
Data Analysis
Manual Calculation:
Manual calculation was performed by creating
a processing method to extract chromatograms and calculate peak
areas for each analyte and IS using Thermo
Scientific™Xcalibur™
software.
Peak areas were exported in Excel (Microsoft Co.) format and copied
and pasted into an Excel worksheet setup to calculate analyte
concentrations and values based on the same formulas used by the
meta-calculation software.
For
Concen
(User D
For
Peak
(User D


