
4
Spectrum Library Retention Time Prediction Based on Endogenous Peptide Standards
eveloping targeted
ation about
ary data are collected
eptide standards can
n time in new
those peptide
ent a method for
tandards and
other peptides including
bility to both unmodified
on various human lung
ol human tissue samples.
TP probes were used to
the active sites were
dients (2 hr on HPLC, 2
t used a 4 hr gradient on
LTQ Orbitrap™ MS
Proteome Discoverer™
Crystal node for PD
library entries and find
.
library collected spectra
varying frequency,
st frequently seen
etention time information
tra from 250 LC-MS runs
odified forms). As these
e first sought appropriate
e landmarks are those
frequency of peptides in
e observed in every run,
ces. (Figure 1) We
ere seen in no fewer
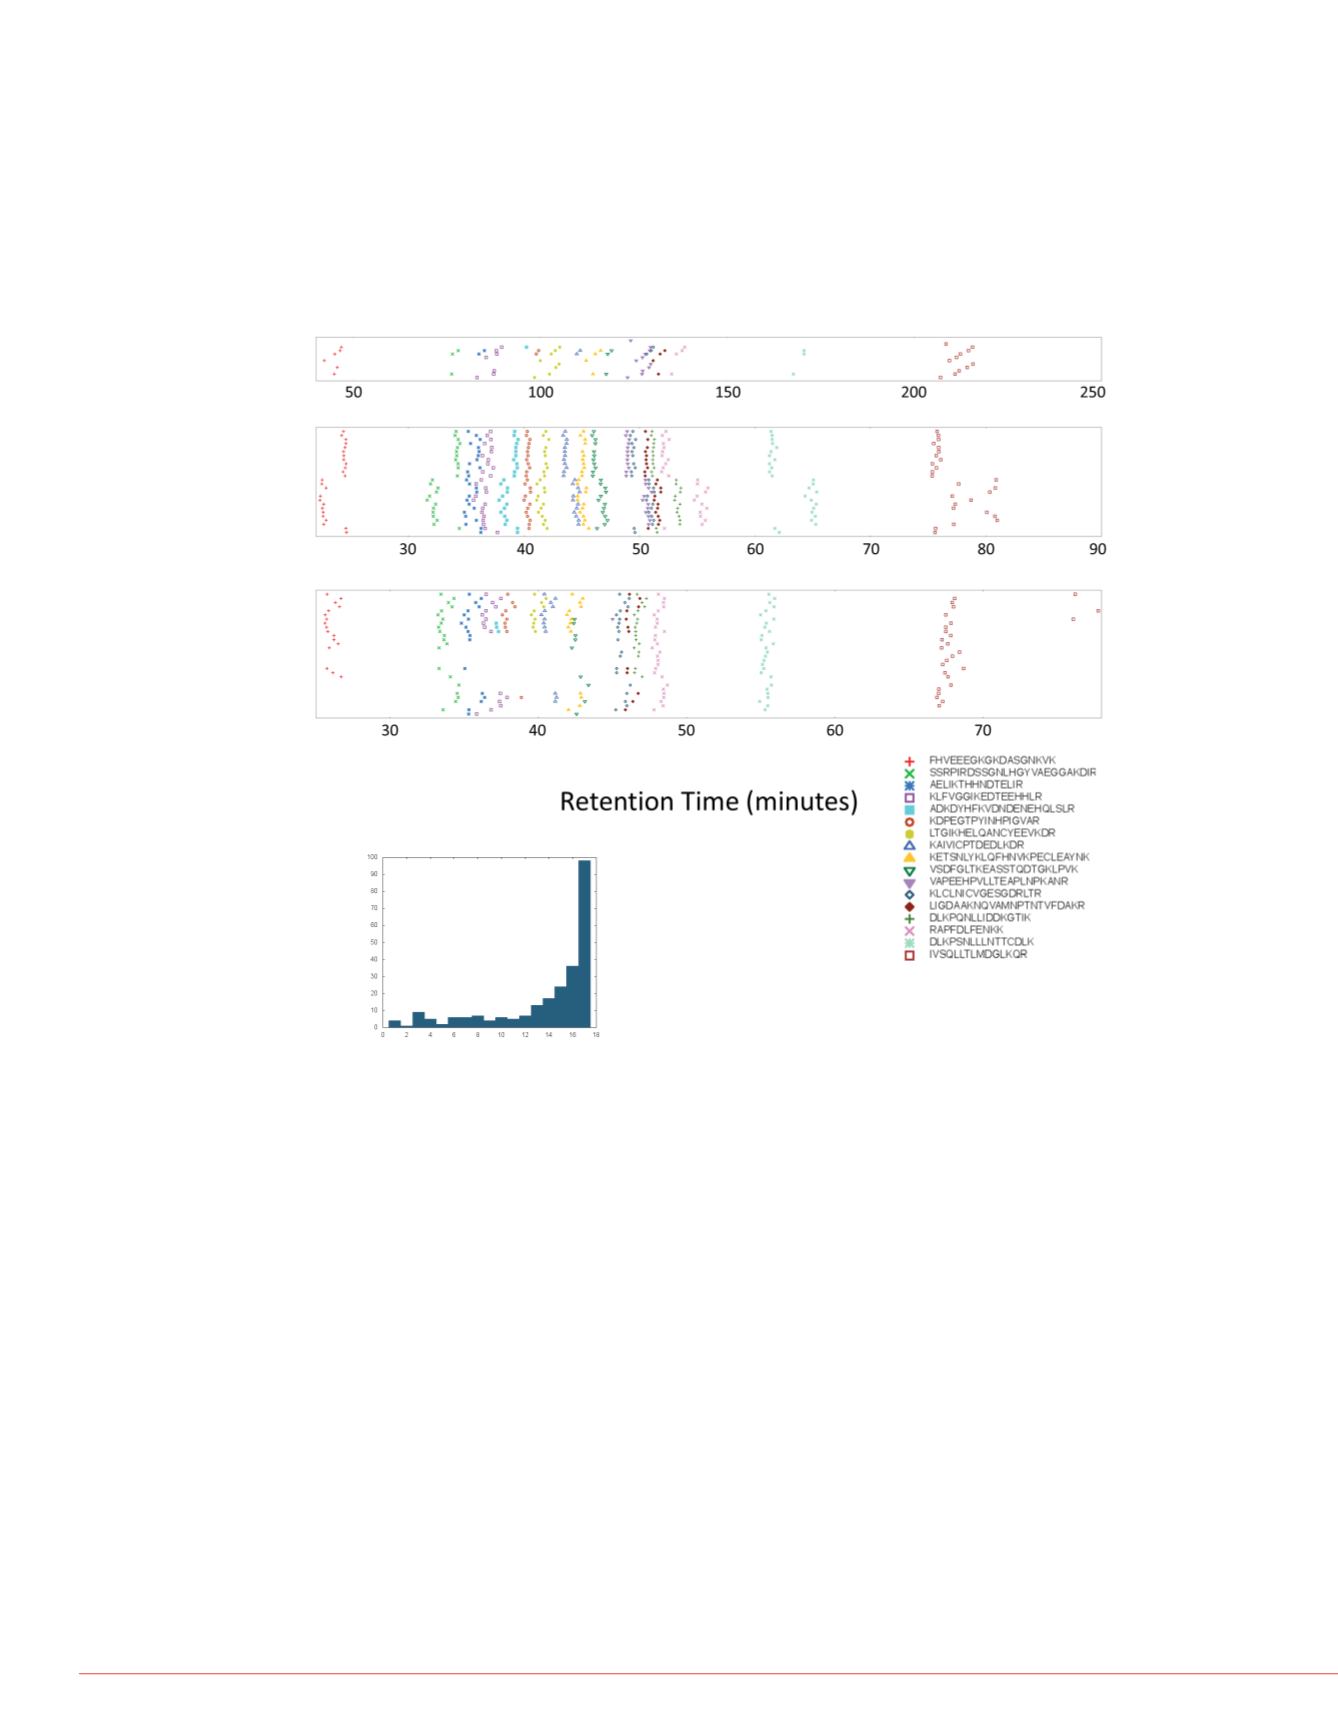
observed retention times in several library runs in Figure 2.
FIGURE 2. A. Retention times of landmark peptides in library data. The
observed retention times of the seventeen peptides selected to act as
landmarks were plotted for 68 runs in the library. Runs from each of three
gradients are plotted together. The rank order of the peptides is the same
in all runs, but the absolute times differ even for runs with the same
gradient. Peptides are distributed across the entire gradient, with a higher
density in the early-to-middle times. B. Histogram of number of landmark
peptides in each run. Not every peptide was observed in every run, but
there are enough in most cases to cover the whole gradient.
Conclusi
Endogenous p
accurately esti
Spectrum li
Our algorit
act as stan
We can ac
estimating i
more easily
measurem
scheduled
Library-bas
than predic
Referenc
1. Krokhin OV
hydrophobi
chromatogr
Acknowl
This research h
CA076292, P5
and the Americ
Foundation.
All trademarks are th
For Research Use O
This information is n
intellectual property r
Landmark Peptides Observed
Number of Runs
FIGURE 4. Co
peptides. A. H
both predictio
time vs. the ob
Use Relative Retention Times to Estimate RT on New Gradient
The Crystal library computes a relative retention time for each peptide stored in
the library as a distance between the two nearest landmark peptides. (Figure 3a)
These are used to estimate the retention times on a new gradient (Figure 3b).
First, the RT of the landmarks must be measured on the new gradients. Then
the relative RTs can be projected on to this new gradient and the average time is
taken as the estimate.
We estimated the times of 1750 peptides on a 4 hour gradient. In addition, we
compare our estimates to estimates based on peptide hydrophobicity (Krohkin,
2009). The accuracy of the estimate is measured as the difference between the
estimated and observed times. Figure 4 plots the accuracy of the two estimation
methods as well as accuracy of the library predictions as a function of the
observed time. Library predictions are much closer than the hydrophobicity
predictions to the observed retention times with most falling with in +/- 10
minutes of the observed time. Predictions are not consistently earlier or later
than observed, but there is a slight trend for the prediction to be too early at the
beginning of the run and too late at the end of the run. This may be due to
having fewer landmarks at the ends of the run.
-100
-5
60
40
20
80
100
120
140
160
Number of peptides
10
Tim
A
A.
B.


