
3
Thermo Scientific Poster Note
•
PN-MSACL-2014-Spectral-Libraries-Frewen_E_03/14S
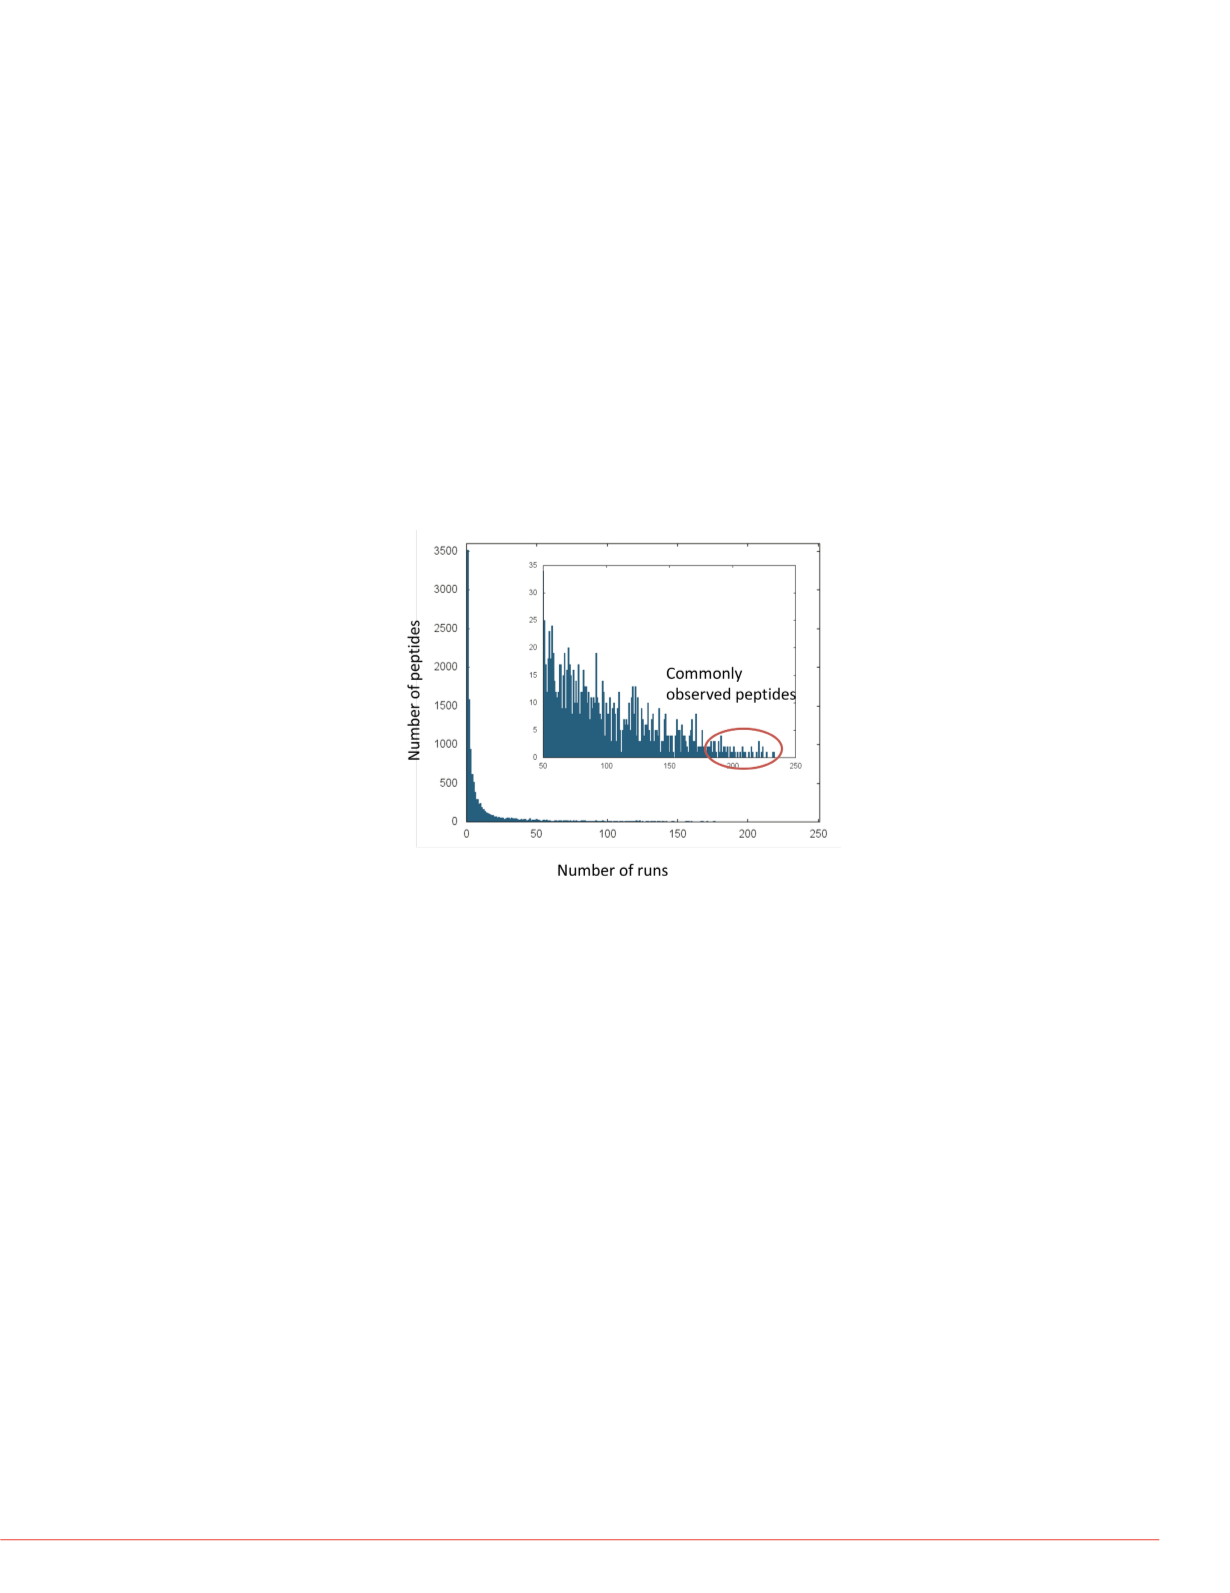
FIGURE 1. Frequency of peptide observation. The library collected spectra
from 250 DDA runs. Peptides were observed with varying frequency,
between 1 and 233 runs. We focused on the 50 most frequently seen
peptides (circled in inset).
Results
Peptide Frequency in the Spectrum Library
Assembly of the Crystal spectrum library collected the retention time information
into one resource. The library contained 220,542 spectra from 250 LC-MS runs
including 9,109 peptide sequences (12,063 total with modified forms). As these
samples did not contain a synthetic peptide standard, we first sought appropriate
endogenous peptides.
The best candidates for peptides to act as retention time landmarks are those
most commonly seen from run to run. We looked at the frequency of peptides in
the 250 runs used to build the library. No peptides were observed in every run,
the most commonly seen peptide having 233 appearances. (Figure 1) We
selected the 50 most commonly seen peptides which were seen in no fewer
than 185 runs.
Landmark Peptides Obs
Number of Runs
Use Relative Retent
The Crystal library co
the library as a distan
These are used to es
First, the RT of the la
the relative RTs can
taken as the estimate
We estimated the tim
compare our estimat
2009). The accuracy
estimated and obser
methods as well as a
observed time. Libra
predictions to the obs
minutes of the obser
than observed, but th
beginning of the run
having fewer landma
B.
n spectrum library data
ic standards.
/MS data into a library
genous peptides to act
any peptide in the
ate endogenous
he library allowed us to
tely than predictions
eloping targeted
ion about
data are collected
tide standards can
time in new
hose peptide
t a method for
ndards and
er peptides including
lity to both unmodified
tion Time Prediction Based on Endogenous Peptide Standar
Peterman
1
, John Koomen
2
, Jiannong Li
2
, Eric Haura
2
, Bryan Krastins
1
, David Sar acin
Center, Cambridge, MA,
2
Moffitt Cancer Center, Tampa, FL
Endogenous Peptides for Retention Time Landmarks
Starting with the 50 most commonly seen peptides, we winnowed down the list
to find a set of peptides that both covered the entire elution profile and
consistently eluted in the same order relative to each other. An in-house script
automated the process. First we record the relative order of the 50 peptides in all
250 runs, for each pair of peptides A and B, keeping track of how often A came
before B. Next we use a greedy algorithm to select a consistent set.
• Start the set with one peptide.
• For each remaining peptide, try adding it to the set in the
appropriate order.
• If it cannot be placed unambiguously relative to the existing
peptides in the set, eliminate this peptide.
We found seventeen that eluted in a consistent order. They are plotted at their
observed retention times in several library runs in Figure 2.
FIGURE 2. A. Retention times of landmark peptides in library data. The
observed retention times of the seventeen peptides selected to act as
landmarks were plotted for 68 runs in the library. Runs from each of three
gradients are plotted together. The rank order of the peptides is the same
in all runs, but the absolute times differ even for runs with the same
gradient. Peptides are distributed across the entire gradient, with a higher
density in the early-to-middle times. B. Histogram of number of landmark
peptides in each run. Not every peptide was observed in every run, but
there are enough in most cases to cover the whole gradient.
FIGURE 3. A. O
distance betwe
predictions are
times of the lan
FIGURE 4. Com
peptides. A. Hi
both prediction


