
5
Thermo Scientific Poster Note
•
PN64039 HUPO14_E 04/14S
Conclusion
MSIA D.A.R.T. extraction increases options for developing targeted
protein quantitation and transition into routine, analysis by:
Non-disruptive sample extraction process facilitates serial
extraction using different MSIA D. A.R.T. tips.
Serial extraction facilitates efficient multiplexing strategies on
low sample volume.
Serial extraction using same Ab (pooling) increases target
protein characterization, including N- and O-linked
glycopeptide/glycoform determinations.
Offline immunoaffinity extraction increases throughput by
ge maps for serotransferrin from
sted plasma and 2(b) pooled
shows the pooled extracted
e map as determined from
en sequence sites are attributed
mino acid residues poorly
g) and sites of glycosylation.
ore generically Separations)
using a Thermo Fisher Scientific™
lumn with 1.9 µm particle size and
ised of A) 0.1% formic acid and B)
inear gradient of 5-32% B was
or to column washing and re-
d on a Thermo Scientific™ Q
operated in data
mode using a Top 10 acquisition
were acquired using a resolution
duct ion spectra were acquired
was performed using Thermo
rer™ 1.4 to Thermo Scientific™
-linked glycopeptides through the
peptides (modified and
rmed relative quantitation across
sment was based on retention time
lues, accurate mass (10 ppm
tion. Negative controls were
sor ion intensities for sample RAW
e targeted protein.
ysis of peptide quantitation as a
ooled response for an unlabeled
opeptide. The response is
ide as a function of order
are boxed in Fig. 2c above.
B) Lactotransferrin
C) Serotransferrin
D) Zinc-
α
2-glycoprotein
A) Alpha-1-antitrypsin
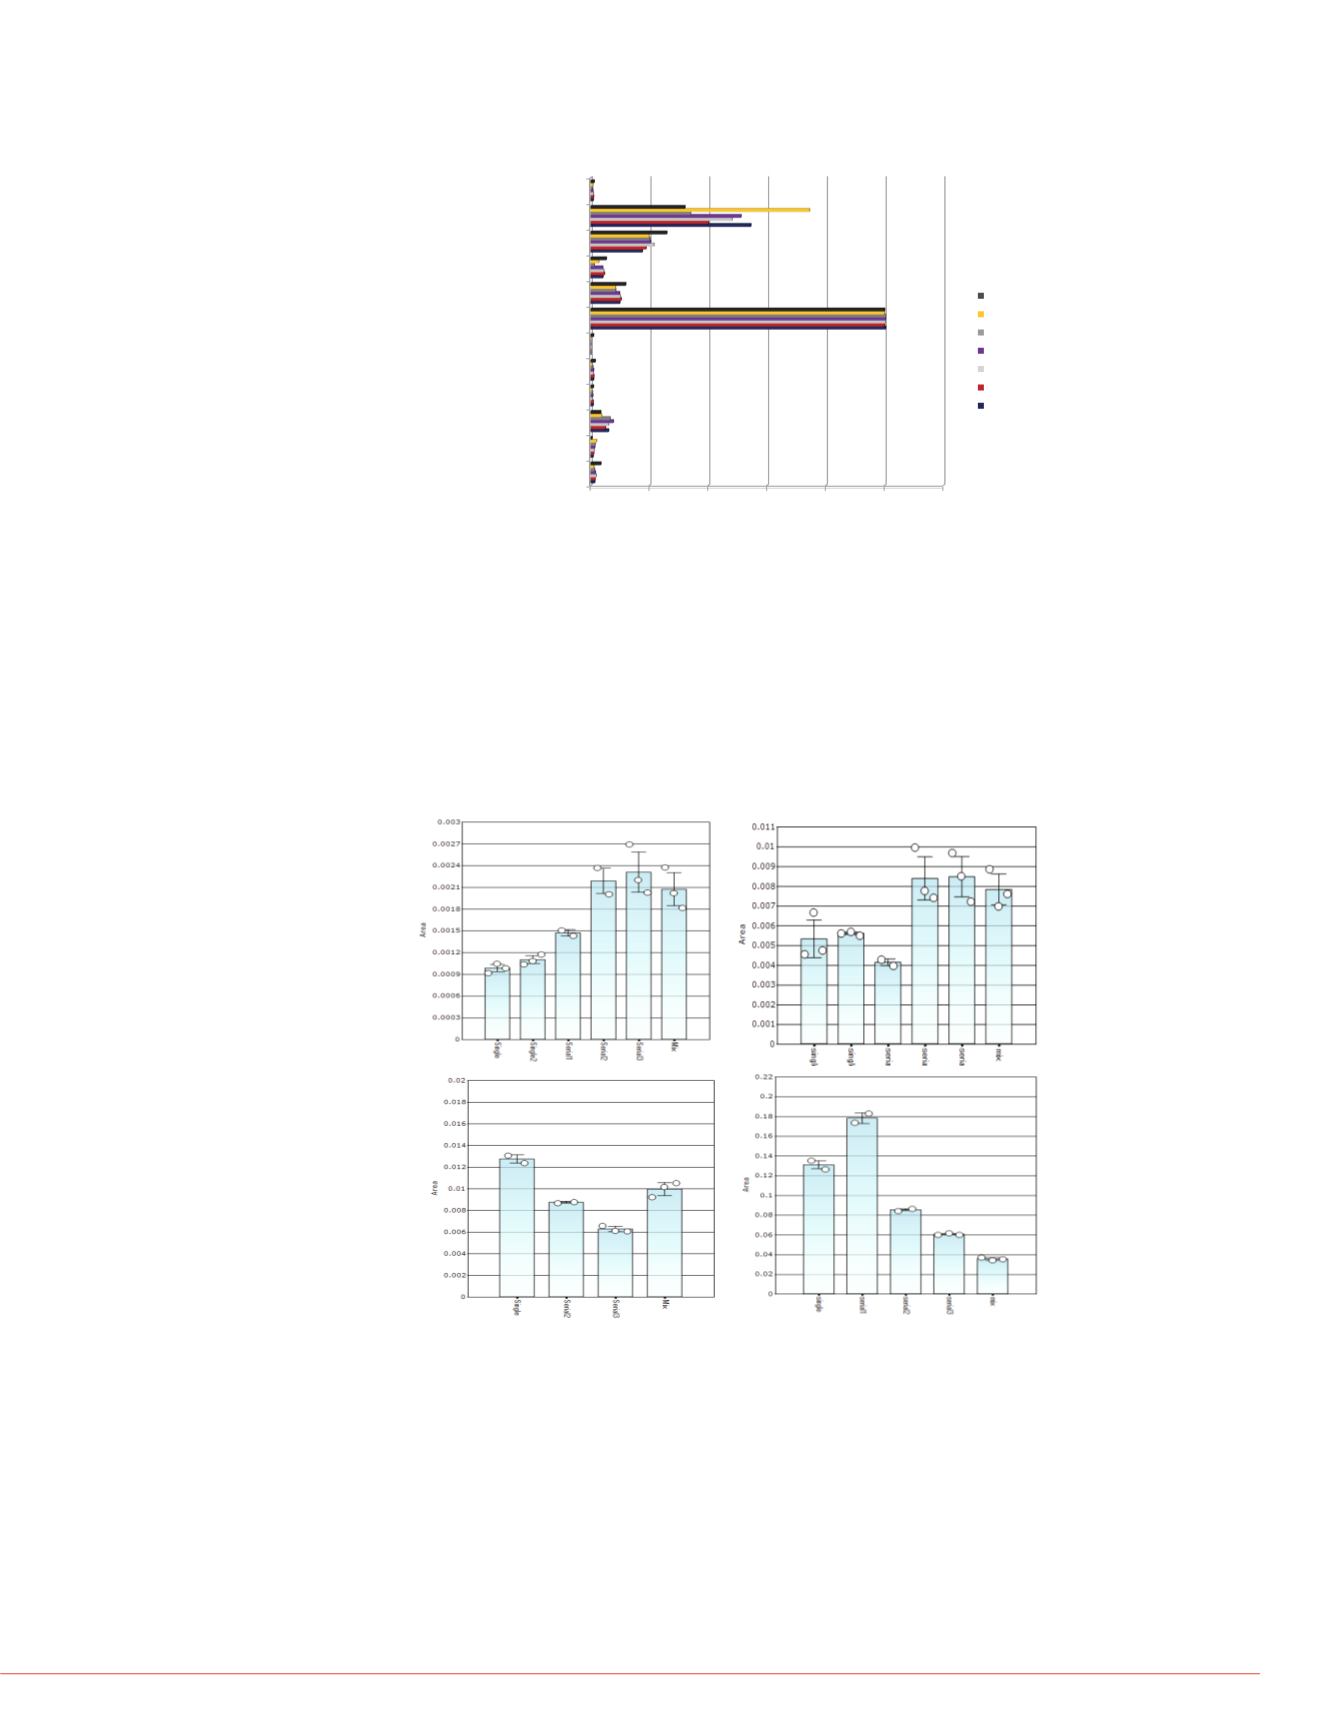
FIGURE 6. Comparative targeted protein response across the
different sample preparation and LC-MS strategies. The
histograms report the normalized protein response for single
MSIA extraction per plasma sample (labeled as “Single”) vs.
serial MSIA extraction of the same plasma sample (labeled as
“Serial”). The numbers behind each sample description
represents the degree of post-extraction multiplexing prior to LC-
MS analysis. For example, Figure 4A shows Single2 and Serial2
where the alpha-1-antitrypsin extraction was mixed with one
other targeted protein extraction prior to LC-MS analysis.
C*GLVPLAENYN[Hex5HexNAc4NeuAc2]K
0.0
20.0
40.0
60.0
80.0 100.0 120.0
dHex1Hex5HexNAc5NeuAc1
dHex1Hex4HexNAc4NeuAc
dHex1Hex6HexNAc2
Hex6HexNAc5NeuAc3
Hex6HexNAc5NeuAc2
Hex6HexNAc5NeuAc1
Hex5HexNAc4NeuAc2
Hex5HexNAc4NeuAc1
Hex4HexNAc3NeuAc1
Hex6HexNAc6
Hex4HexNAc4
peptide
Relative AUC Values
N-linked Glycan
pooled
single6
single5
single4
single3
single2
single1
FIGURE 5. Reproducibility of glycan distribution based on
comparative AUC ratios for the serotransferrin peptide
C*GLVPLAENYN*K.S as a function of MSIA extraction.


