
3
Thermo Scienti c Poster Note
•
PN63786_E 03/13S
ine Lachambre Analysis Expertise, Epinal, France
THC and THC-COOH from whole
y. For confirmation purposes,
5 ng/mL
.
precipitation followed by an online
hromatography (RP-LC) coupled
to
mL for THC and its metabolites with
around the world, and due to its
ve analytical procedures for the
sychoactive constituent product of
rapidly metabolized mainly in11-
d then in 11-nor-
Δ
9
-
H), chemical structures are
nnabis abuse, blood analysis is
C have short windows of detection in
ir analysis are often settled to
MS as a reference method for the
logical matrices in clinical and forensic
larly interesting to attain high
ne of the key parameters to achieve
riate sample treatment prior to the
mated online sample preparation
the quantitative analysis of biological
ure THC and its metabolites by
al performances.
ternal standards (IS) and then mixed
. The mixture was vortexed and
tion, the mixture was centrifuged at
as injected for LC
-MS/MS analysis.
Results
Method Development
Different TurboFlow columns (Cyclon
evaluated with different loading cond
evaluated (Accucore C18, Hypersil
different gradients. And finally, transf
chromatogram is shown in Figure 5.
Recovery and matrix effects
Precipitation Recovery
was obtained
with the analytes and then crashed,
On-line extraction Recovery
was eva
standard solution to the analytical co
Matrix Effects
were evaluated by co
TurboFlow column against an injecti
Overall recovery
was obtained consi
are presented on figure 6.
Calibration curves
Calibration curves were generated
blood samples spiked with THC, 11-
injection Their deuterated (D3) comp
concentration of 17ng/mL The calibr
these conditions, curves were linear
100ng/mL. The calibration curves ar
ocannabinol (THC) and main
ol (11-OH-THC) and 11-nor-Δ9-
OOH).
TurboFlow and LC method
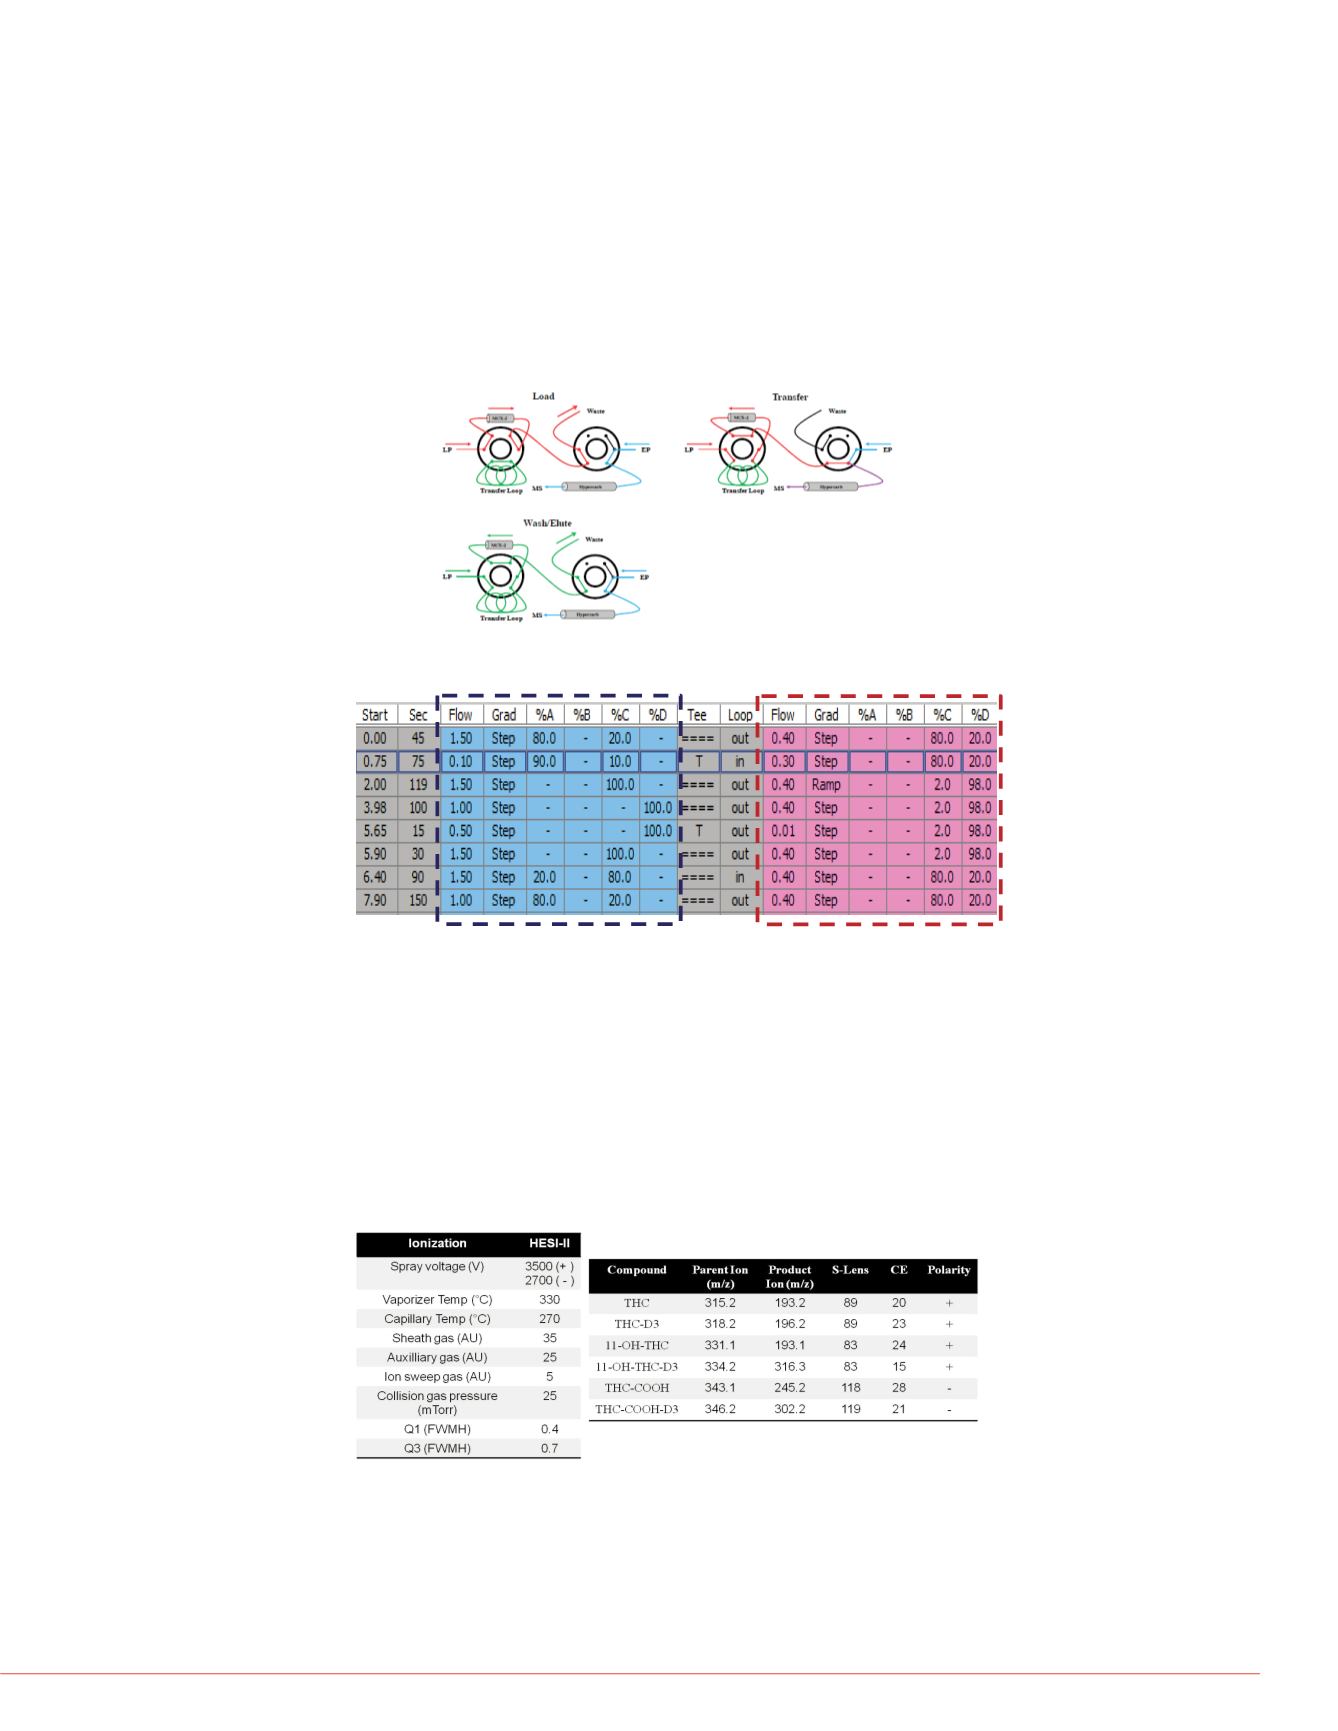
The TurboFlow™ method was performed in Focus mode (figure 2) with a Thermo
Scientific TurboFlow Cyclone-P column. Analytical separation was carried out on a
Thermo Scientific Accucore C18 column (50×2.1 mm, 2.6-
μm particle size) . The
mobile phases were as follows: loading A : 0.1% formic acid in water; loading C: 0.1%
formic acid in acetonitrile; loading D : mixture of isopropanol, acetonitrile, and acetone
(40/40/20 v/v/v) ; elutingC : 10mM ammonium formate + 0.1% formic acid in water;
elutingD : 0.1% formic acid in methanol. The total LC runtime was 10.4 min (Figure 3).
Mass Spectrometry
A Thermo Scientific TSQ Vantage triple stage quadrupole mass spectrometer was
operated with a heated electrospray ionization (HESI-II) source in positive
ionization mode for THC and 11-OH-THC and in negative ionization mode for
THC-COOH. Data were acquired in the selected reaction monitoring (SRM) mode
(Figure 4).
FIGURE 2. . “Focus Mode Technical” diagram of TurboFlow Technology.
FIGURE 3. TurboFlow and LC method conditions.
TurboFlow method conditions
(Loading Pump)
LC gradient conditions
(Eluting Pump)
FIGURE 4.
MS source parameters and SRM transitions.
C:\Users\...\121005-gammefinale\P2-01
1
0.5ppb
RT:
4.00 -7.00
4.0 4.2 4.4 4.6 4.8 5.0 5.2 5.4
Tim
0
50
100
0
50
100
0
50
100
0
50
100
0
50
100
0
50
100
RT:5.38
RT:5.38
RT:5.
RT:5.
FIGURE 5. SRM chromatograms of
deuterated standards (D3) from a bl
FIGURE 6. Method recovery and
The concentration was 7.5 ng/mL in stan
Injection volume was set to 20µL in all c
condition.


