
5
Thermo Scienti c Poster Note
•
PN63786_E 03/13S
Limits of quantification were determined
RSD is obtained as well as a bias inferio
The limits of quantification satisfy the req
blood, considering that the limits of detec
Conclusion
A fast, automated, and analytically
quantify THC and its metabolites i
The total online extraction and ana
throughput could be increased by
Transcend TLX system.
This method was linear from 0.5 to
The lower limit of quantitation was
metabolites. Good repeatability wa
with %RSD inferior to 10%.
Correlation between GC-MS and t
Analysis
–
Expertise laboratory.
References
1. Musshoff F., Burkhard M.
–
Thera
2. Fabritius M., Staub C., Giroud C.
21-35
3. Peters F., Drummer O., Musshoff
216-224
Acknowledgements
We would like to thank Dr Christophe Pe
blood samples and the standards for this
oro, Phenyl-Hexyl) were
nt separation columns were
e PFP and Accucore aQ) with
s also studied. The final
injection of whole blood spiked
od crashed first and then spiked.
ing a direct injection of a
njection to the TurboFlow column.
n of standard solution to the
at the same concentration.
ery and matrix effects. Results
SP1 software by injecting whole
-COOH. And crashed before
as internal standards. With a
near with an equal weighting. In
ation range, from 0.5ng/mL to
re 7.
6.4 6.6 6.8 7.0
NL:1.33E6
TIC F:+pESISRMms2315.179
[193.165-193.175] MS Genesis
P2-01
NL:1.10E7
TIC F:+pESISRMms2318.240
[196.195-196.205] MS Genesis
P2-01
NL:7.39E5
m/z=192.62-193.62F:+pESISRM
ms2331.156 [193.115-193.125,
201.125-201.135] MSP2-01
NL:2.67E7
TIC F:+pESISRMms2334.210
[316.305-316.315] MS Genesis
P2-01
NL:3.38E4
TIC F: -pESISRMms2343.097
[245.225-245.235] MS Genesis
P2-01
NL:1.84E6
TIC F: -pESISRMms2346.200
[302.155-302.165] MS Genesis
P2-01
HC
-D3
HC-D3
H-THC
OOH
OH-D3
and THC-COOH as well as
ed at 0.5 ng/mL.
le blood and whole blood samples.
s were performed in each
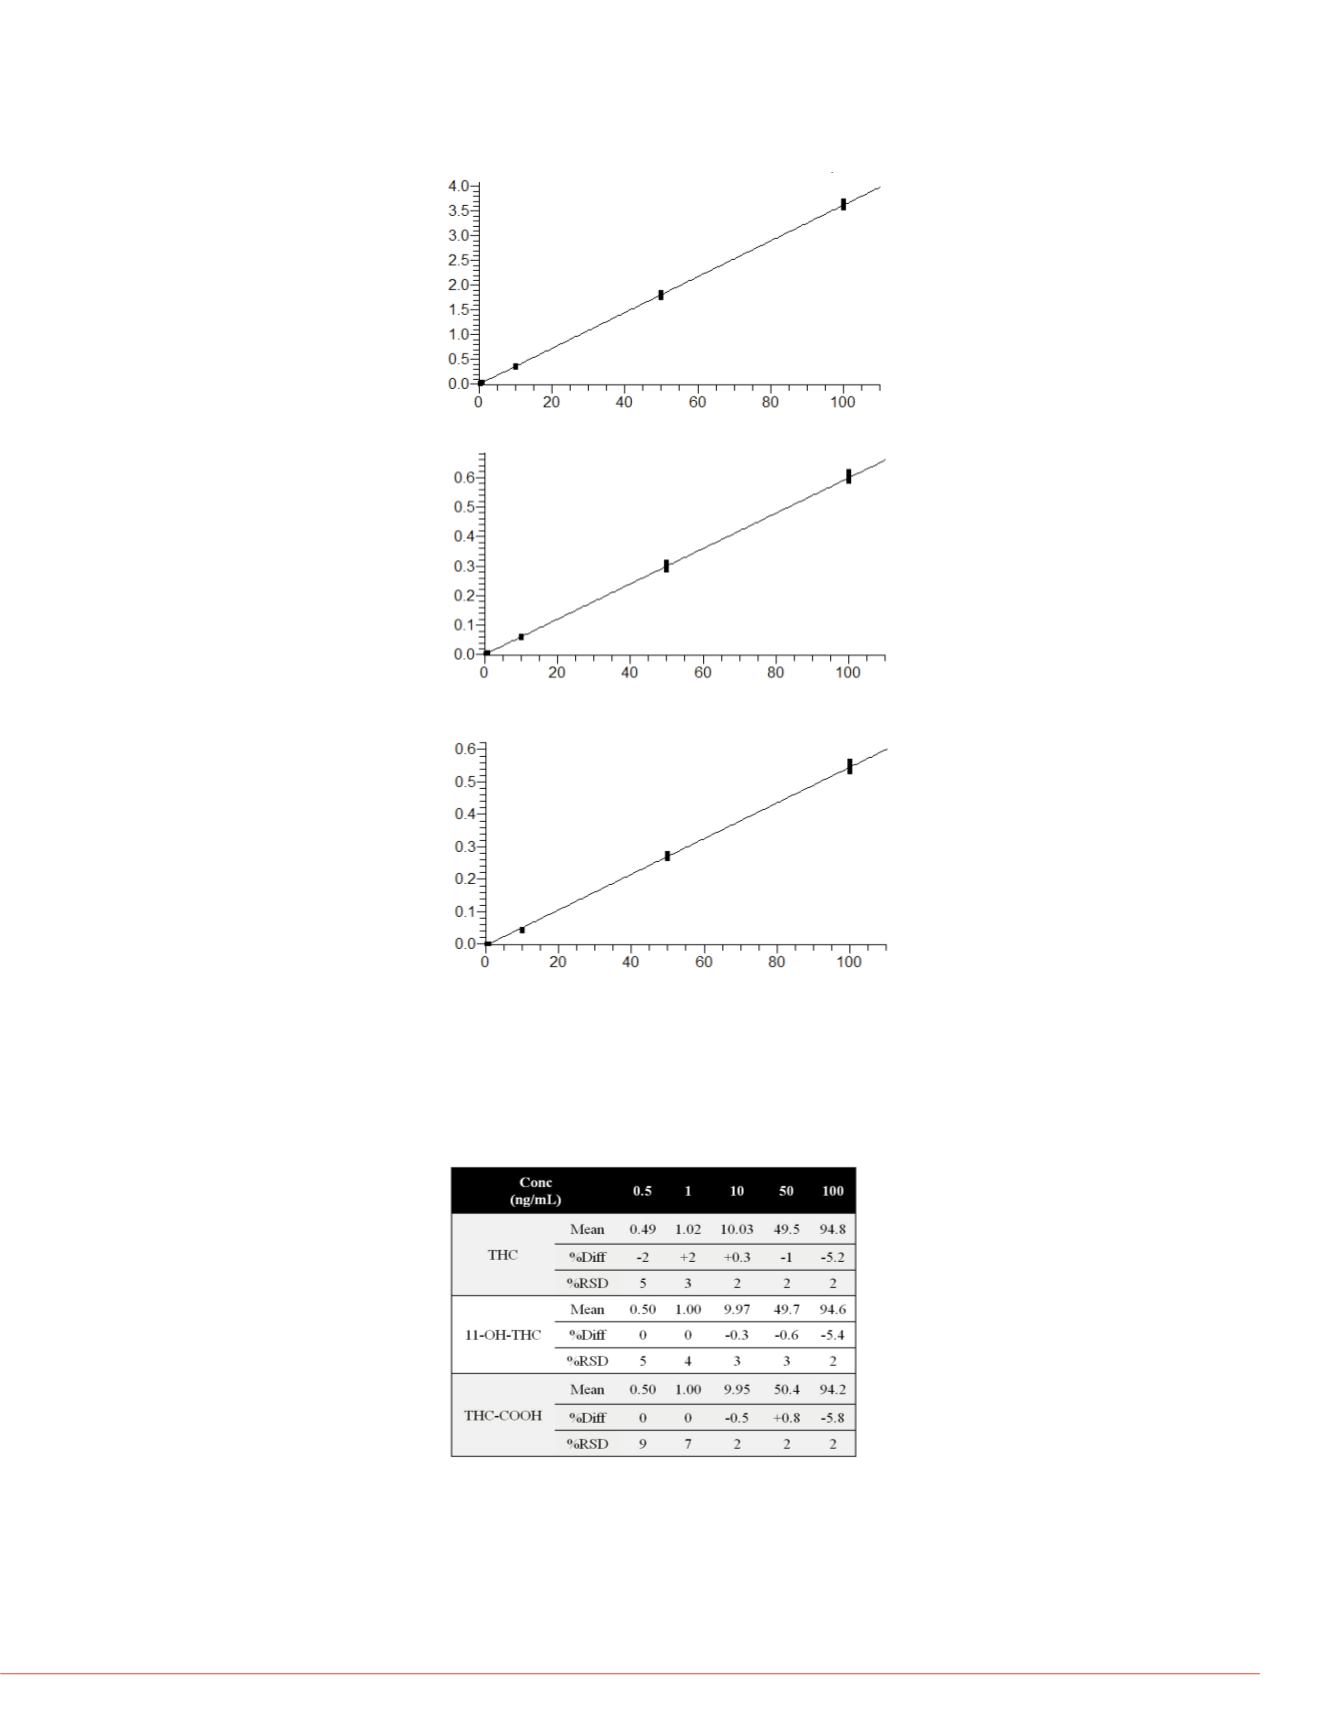
FIGURE 7. Calibration curves for THC, 11-OH-THC and THC-COOH from spiked
and crashed whole blood. Calibration ranges goes from 0.5ng/mL to 100ng/mL.
THC
Y = -0.0033 + 0.036 X
R² = 0.9995 W = Equal
Concentration (ng/mL)
Area ratio
11_OH-THC
Y = 0.0059 X
R² = 0.9993 W = Equal
Concentration (ng/mL)
Area ratio
THC-COOH
Y = -0.005 + 0.0055 X
R² = 0.9988 W = Equal
Concentration (ng/mL)
Area ratio
Each calibration point was injected 10 times. The mean calculated concentration, the
accuracy (%Diff) and the repeatability (%RSD) for each calibration point are presented
in figure 8.
FIGURE 8. Accuracy (%Diff) and repeatability (%RSD) obtained for each
calibrator (n=10)
FIGURE 9. Limits of quantification for
and crashed whole blood samples.
All trademarks are the property of Thermo
This information is not intended to encour
infringe the intellectual property rights of o


