
4
Quantitative Analysis of THC and Main Metabolites in Whole Blood Using Tandem Mass Spectrometry and Automated Online Sample Preparation
nal, France
Results
Method Development
Different TurboFlow columns (Cyclone, Cyclone P, Fluoro, Phenyl-Hexyl) were
evaluated with different loading conditions. Also different separation columns were
evaluated (Accucore C18, Hypersil Gold C18, Accucore PFP and Accucore aQ) with
different gradients. And finally, transfer optimization was also studied. The final
chromatogram is shown in Figure 5.
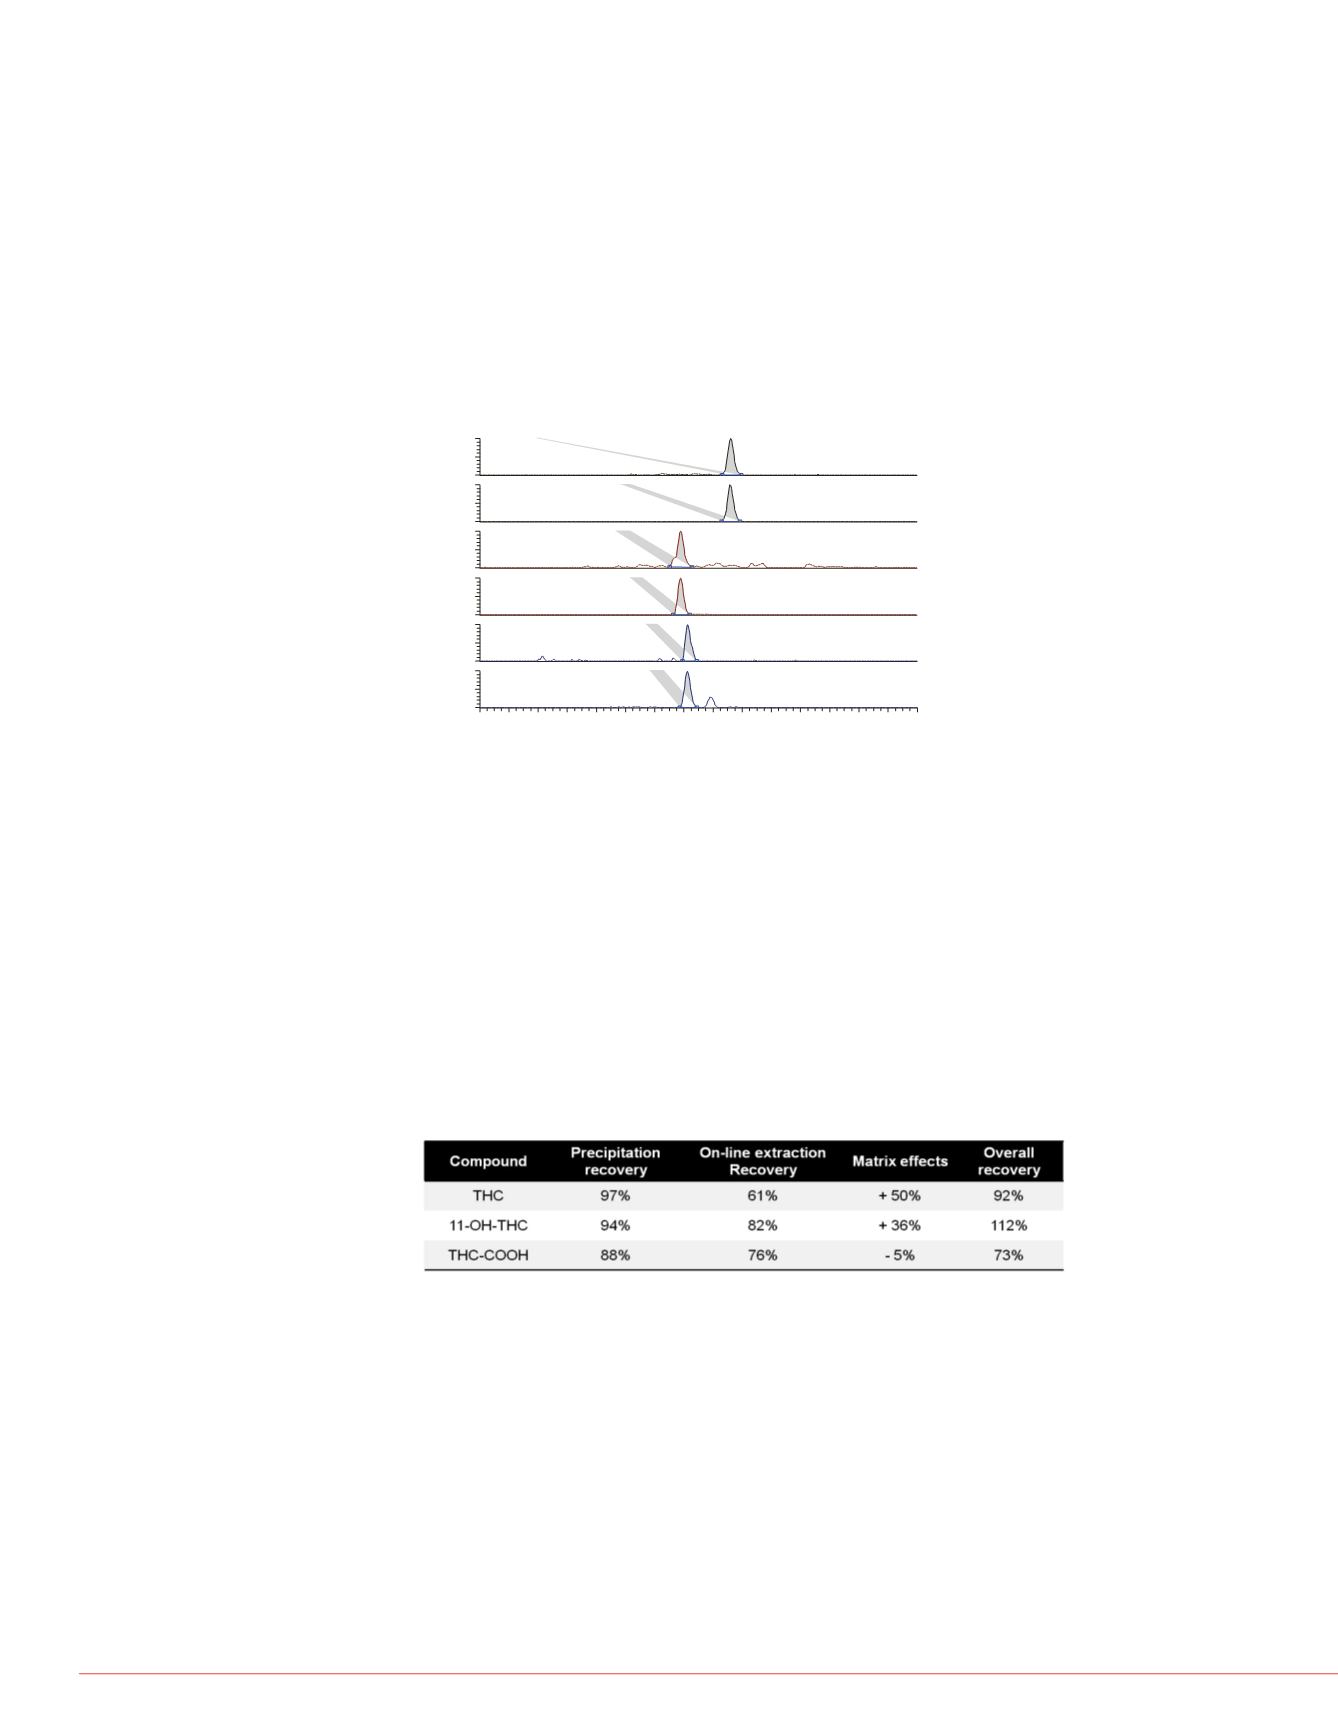
Recovery and matrix effects
Precipitation Recovery
was obtained by comparing an injection of whole blood spiked
with the analytes and then crashed, against whole blood crashed first and then spiked.
On-line extraction Recovery
was evaluated by comparing a direct injection of a
standard solution to the analytical column against an injection to the TurboFlow column.
Matrix Effects
were evaluated by comparing an injection of standard solution to the
TurboFlow column against an injection of blood spiked at the same concentration.
Overall recovery
was obtained considering both recovery and matrix effects. Results
are presented on figure 6.
Calibration curves
Calibration curves were generated with LCQuan 2.7 SP1 software by injecting whole
blood samples spiked with THC, 11-OH-THC and THC-COOH. And crashed before
injection Their deuterated (D3) compounds were used as internal standards. With a
concentration of 17ng/mL The calibration model was linear with an equal weighting. In
these conditions, curves were linear through the calibration range, from 0.5ng/mL to
100ng/mL. The calibration curves are presented in figure 7.
d in Focus mode (figure 2) with a Thermo
Analytical separation was carried out on a
(50×2.1 mm, 2.6-
μm particle size) . The
A : 0.1% formic acid in water; loading C: 0.1%
xture of isopropanol, acetonitrile, and acetone
nium formate + 0.1% formic acid in water;
The total LC runtime was 10.4 min (Figure 3).
le stage quadrupole mass spectrometer was
onization (HESI-II) source in positive
HC and in negative ionization mode for
e selected reaction monitoring (SRM) mode
diagram of TurboFlow Technology.
d conditions.
ions
LC gradient conditions
(Eluting Pump)
and SRM transitions.
C:\Users\...\121005-gammefinale\P2-01
10/4/201210:59:29PM
0.5ppb
RT:
4.00 -7.00
4.0 4.2 4.4 4.6 4.8 5.0 5.2 5.4 5.6 5.8 6.0 6.2 6.4 6.6 6.8 7.0
Time (min)
0
50
100
0
50
100
0
50
100
0
50
100
0
50
100
0
50
100
RT:5.72
RT:5.71
RT:5.38
RT:5.38
RT:5.42
RT:5.42
NL:1.33E6
TIC F:+pESISRMms2315.179
[193.165-193.175] MS Genesis
P2-01
NL:1.10E7
TIC F:+pESISRMms2318.240
[196.195-196.205] MS Genesis
P2-01
NL:7.39E5
m/z=192.62-193.62F:+pESISRM
ms2331.156 [193.115-193.125,
201.125-201.135] MSP2-01
NL:2.67E7
TIC F:+pESISRMms2334.210
[316.305-316.315] MS Genesis
P2-01
NL:3.38E4
TIC F: -pESISRMms2343.097
[245.225-245.235] MS Genesis
P2-01
NL:1.84E6
TIC F: -pESISRMms2346.200
[302.155-302.165] MS Genesis
P2-01
THC
THC-D3
11-OH-THC-D3
11-OH-THC
THC-COOH
THC-COOH-D3
FIGURE 5. SRM chromatograms of THC, 11-OH-THC and THC-COOH as well as
deuterated standards (D3) from a blood sample spiked at 0.5 ng/mL.
FIGURE 6. Method recovery and matrix effects.
The concentration was 7.5 ng/mL in standard , crashed whole blood and whole blood samples.
Injection volume was set to 20µL in all cases and 5 injections were performed in each
condition.
FIGURE 7. Calibration c
and crashed whole bloo
TH
Y =
R²
Area ratio
1
Y
R
Area ratio
T
Y
R
Area ratio
Each calibration point wa
accuracy (%Diff) and the
in figure 8.
FIGURE 8. Accuracy (%
calibrator (n=10)


