
4
Direct Analysis using Paper-Spray Mass Spectrometry: Method Development for the Rapid Screening of Drugs of Abuse for Forensic Toxicology
lia, Inc., IN) showing,
hanism for dispensing
ple deposition and DBS-
ectrometer inlet.
Results
Screening for drugs of abuse: resolving power, accurate mass for compound
identification
• Figure 2 shows that high and ultrahigh resolving powers (70,000 and 140,000 FWHM
FIGURE 4. Accurate mas
at m/z 200) showing drug
analyzed from DBS.
meth-
at
m/z
200) are required when evaluating samples from complex matrices with no
sample preparation and no prior chromatographic separation. Mass accuracies 1-2
ppm at the higher resolving powers (70,000 and 140,000, FWHM at m/z 200).
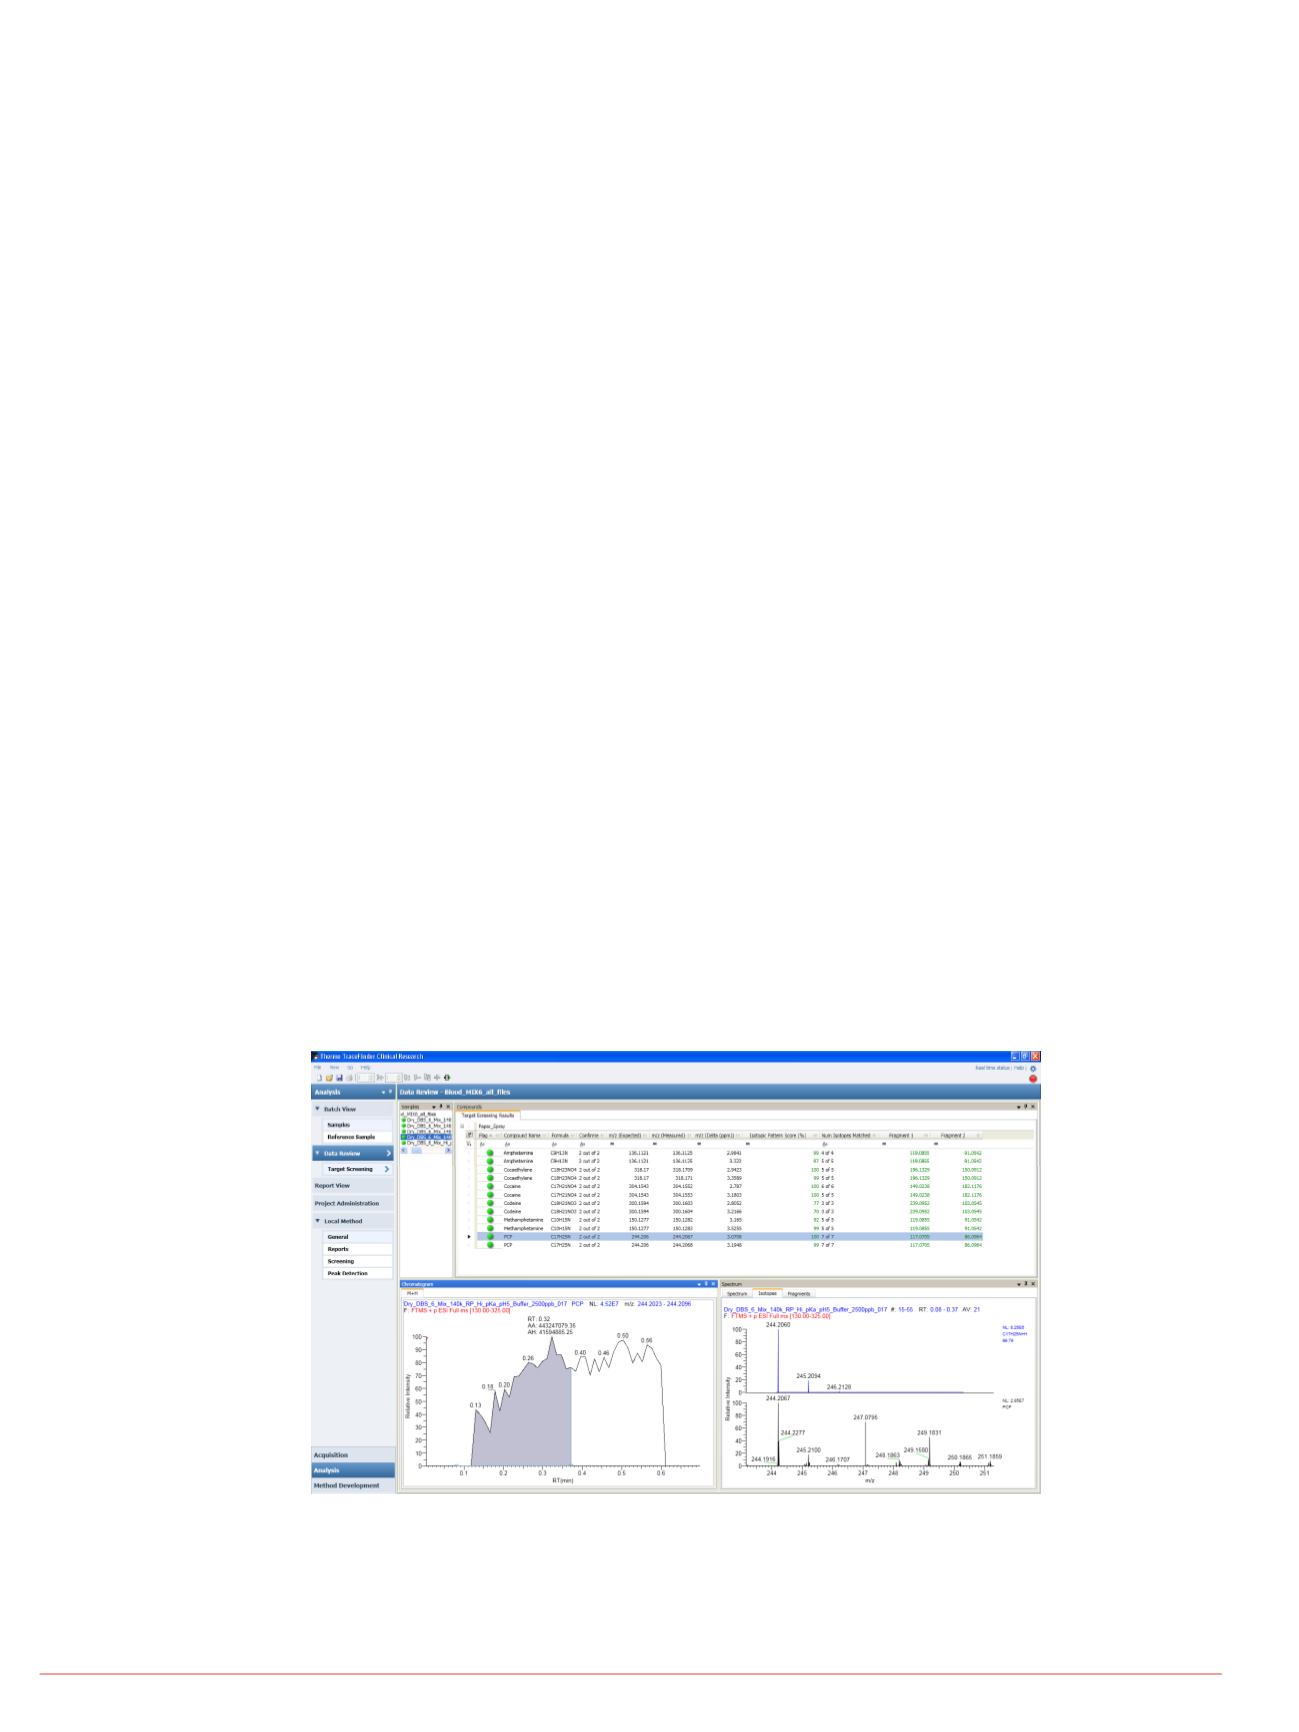
• Results from TraceFinder software, which is effectively used for targeted or unknown
screening analysis, are neatly summarized in Figure 3. All six drugs are positively
40
60
80
100
136.1125
40
60
80
100
150.1282
150.1313
0 ng/mL
amphetamine ampheta
identified from a dry blood spot sample.
Screening for drugs of abuse at various concentrations
• A drug mixture of six compounds was analyzed at 100, 500, 1000 and 2500 ng/mL for
forensic toxicology screening Amphetamine methamphetamine cocaine
60
80
100
0
20
136.1222
136.1125
60
80
100
bundance
0
20
150.1212
150.1282
250
0 ng/mL
.
,
,
,
cocaethylene, codeine and PCP are shown in this work.
• This group of samples were detected by full scan MS down to 100 ng/mL levels (Figure
4) (140,000 resolving power; FWHM at m/z 200).
60
80
100
0
20
40
136.1222
136.1247
136.1125
60
80
100
0
20
40
Relative A
150.1211
150.1282
100
ng/mL
Fragmentation and isotopic pattern matching for compound confirmation
• Accurate mass m/z values were used for identification of screened drugs. Isotopic
pattern matching and two fragments from the AIF experiment were used for drug
confirmation (TraceFinder table Fig. 3). Alternatively, DD MS/MS from a Q Exactive
mass spectrometer can be used.
60
80
100
0
20
40
136.1222
136.1247
136.1154
136.1125
60
80
100
0
20
40
150.1211
150.1130
150.0996
150.1211
150.1130
150.1282
500
ng/mL
• Figure 5 shows accurate mass fragmentation spectra by targeted DD MS/MS for a
DBS sample containing a mixture of 6 drugs. DD MS/MS is acquired at ultra high
resolution for enhanced signal to noise. Please note that at the higher resolution, the
signal to noise is exceptional thus allowing much lower limits of detection than
demonstrated.
136.11
136.12
136.13
m/z
0
20
40
136.1206
136.1246
150.10
150.12
150.1
m/z
0
20
40
150.0999
150.136
100
Quantitation
• Amitriptyline-spiked in blood (10–5,000 ng/mL) yielded limits of quantitation (LOQ) of
25 ng/mL using amitriptyline-
d
3
as internal standard (Figure 6).
FIGURE 5. DD MS/MS fr
(FWHM at m/z 200) in th
signal to noise ratio (as
shown) is observed. Ac
and 1-3 ppm, respective
lving powers,
e.g.
, 70,000 and
tification of drugs from DBS
h six drugs, four drugs shown
and 140 000 top to bottom
• Variability in terms of %RSD (Std Dev/Mean*100) is between <1 to 16% for drug in
blood. Figure 6 displays amitriptyline data for dried blood spots.
FIGURE 3. TraceFinder 3.0 software results shown below. Data processed in
targeted screening analysis mode. All analytes in the mix are positively
id tifi d b
t /
l
d fi
d b i t i
tt
d th
screening applications.
Sample: mixture of six
Concentrations noted in
a)
Amphetamine
,
.
curacies 1-2 ppm.
en e y exac m z va ues an con rme y so op c pa ern an e
presence of two fragments from the AIF experiment (see Table).
Data collected with the Exactive Plus mass spectrometer.
60
100 91.0544
119.0858
1000 ng/mL
.1592
300.2911
318.1711
318.1964
318 1391
deine
cocaethylene
20
60
100
20
91.0544
119.0858
500 ng/mL
300.2190
.1614
300.1810
300.2907
300 2186
.
318.2667
318.1716
318.1916
90
100 110 120
0
20
60
100
91.0543
119.0857
100 ng/mL
60
100 86.0966
159.1173
91 0545
.
.1606
300.2912
300.1794
3
318.1432
318.2648
318.1715
318.1414 318 2840
318.2286
Isotopic pattern match
Simulation
c)
PCP
100
20
60
100
20
.
86.0966
159.1172
91.0544
300.2 300.3
.1608
300.2910
300.2185
1
300.3274
318.1 318.2 318.3
.
318.1711
318.1417318.1907318.2836
Experimental
500
0
20
60
100
104.1071
86.0966
159.1172
95.0857 135.1171
m/z
m/z
100
100
150
20


