
5
Thermo Scientific Poster Note
•
PN64316-EN 1114S
FIGURE 6a. Full scan MS s
e mass for compound
70,000 and 140,000 FWHM
FIGURE 4. Accurate mass (3-4 ppm) MS spectra at 140,000 resolving power (FWHM
at m/z 200) showing drugs detected down to 100 ng/mL. Sample contained six drugs
analyzed from DBS.
meth-
the [M+H]
+
ion of amitriptyli
various concentrations fro
samples. Acquired at 70,00
power.
Mass accuracy 2-3 pp
omplex matrices with no
tion. Mass accuracies 1-2
, FWHM at m/z 200).
ed for targeted or unknown
l six drugs are positively
40
60
80
100
136.1125
40
60
80
100
150.1282
150.1313
40
60
80
100
244.2067
40
60
80
100
300.1604
300.1661
300.1787
300.1426
40
60
80
100
304.1552
40
60
80
100
318.1710
0 ng/mL
amphetamine
PCP
codeine
cocaethylene
cocaine
amphetamine
50
100
0
50
100
278.1911
278.1910
5000 ng/mL
1000 ng/mL
0, 1000 and 2500 ng/mL for
tamine cocaine
60
80
100
0
20
136.1222
136.1125
60
80
100
bundance
0
20
150.1212
150.1282
60
80
100
bundance
0
20
244.2277
244.1916
244.2475
244.2067
244.2278
60
80
100
bundance
0
20
300.2024
300.1427
300.1604
300.1661
300.1790
60
80
100
bundance
0
20
304.1910
304.1458
304.1646
304.1552
60
80
100
bundance
0
20
318.1918
318.1405
318.2283
318.1708
250
0 ng/mL
100
0
50
100
0
278.1910
278.1909
500 ng/mL
250 ng/mL
,
,
n to 100 ng/mL levels (Figure
60
80
100
0
20
40
136.1222
136.1247
136.1125
60
80
100
0
20
40
Relative A
150.1211
150.1282
60
80
100
0
20
40
Relative A
244.1915
244.2470
244.2067
244.2278
60
80
100
0
20
40
Relative A
300.2024
300.1426
300.1787
300.1603
60
80
100
0
20
40
Relative A
304.1973
304.1760
304.1552
60
80
100
0
20
40
Relative A
318.1403
318.1919
318.1708
100
ng/mL
100
0
50
100
0
50
278.1910
2
278.1909
100 ng/mL
50 ng/mL
und confirmation
screened drugs. Isotopic
ent were used for drug
MS/MS from a Q Exactive
60
80
100
0
20
40
136.1222
136.1247
136.1154
136.1125
60
80
100
0
20
40
150.1211
150.1130
150.0996
150.1211
150.1130
150.1282
60
80
100
0
20
40
244.1914
244.2471
244.2278
244.2066
60
80
100
0
20
40
300.2024
300.1426
300.1661
60
80
100
0
20
40
304.1891
304.1377
304.1551
60
80
100
0
20
40
318.1404
318.1919
318.1708
318.1402
500
ng/mL
100
0
50
100
0
50
2
278.1911
2
278.1909
2
25 ng/mL
10 ng/mL
300.1603
Conclusion
targeted DD MS/MS for a
is acquired at ultra high
at the higher resolution, the
its of detection than
136.11
136.12
136.13
m/z
0
20
40
136.1206
136.1246
150.10
150.12
150.14
m/z
0
20
40
150.0999
150.1363
244.20
m/z
0
20
40
244.1914
244.2471
300.15
300.20
m/z
0
20
40
300.1870
304.15
304.20
m/z
0
20
40
304.1763
304.1373
318.1
318.2
m/z
0
20
40
318.2284
318.1919
100
278.15
278.20
m/z
0
50
• We have shown an easy to
that shows extraordinary p
forensic toxicology.
its of quantitation (LOQ) of
re 6).
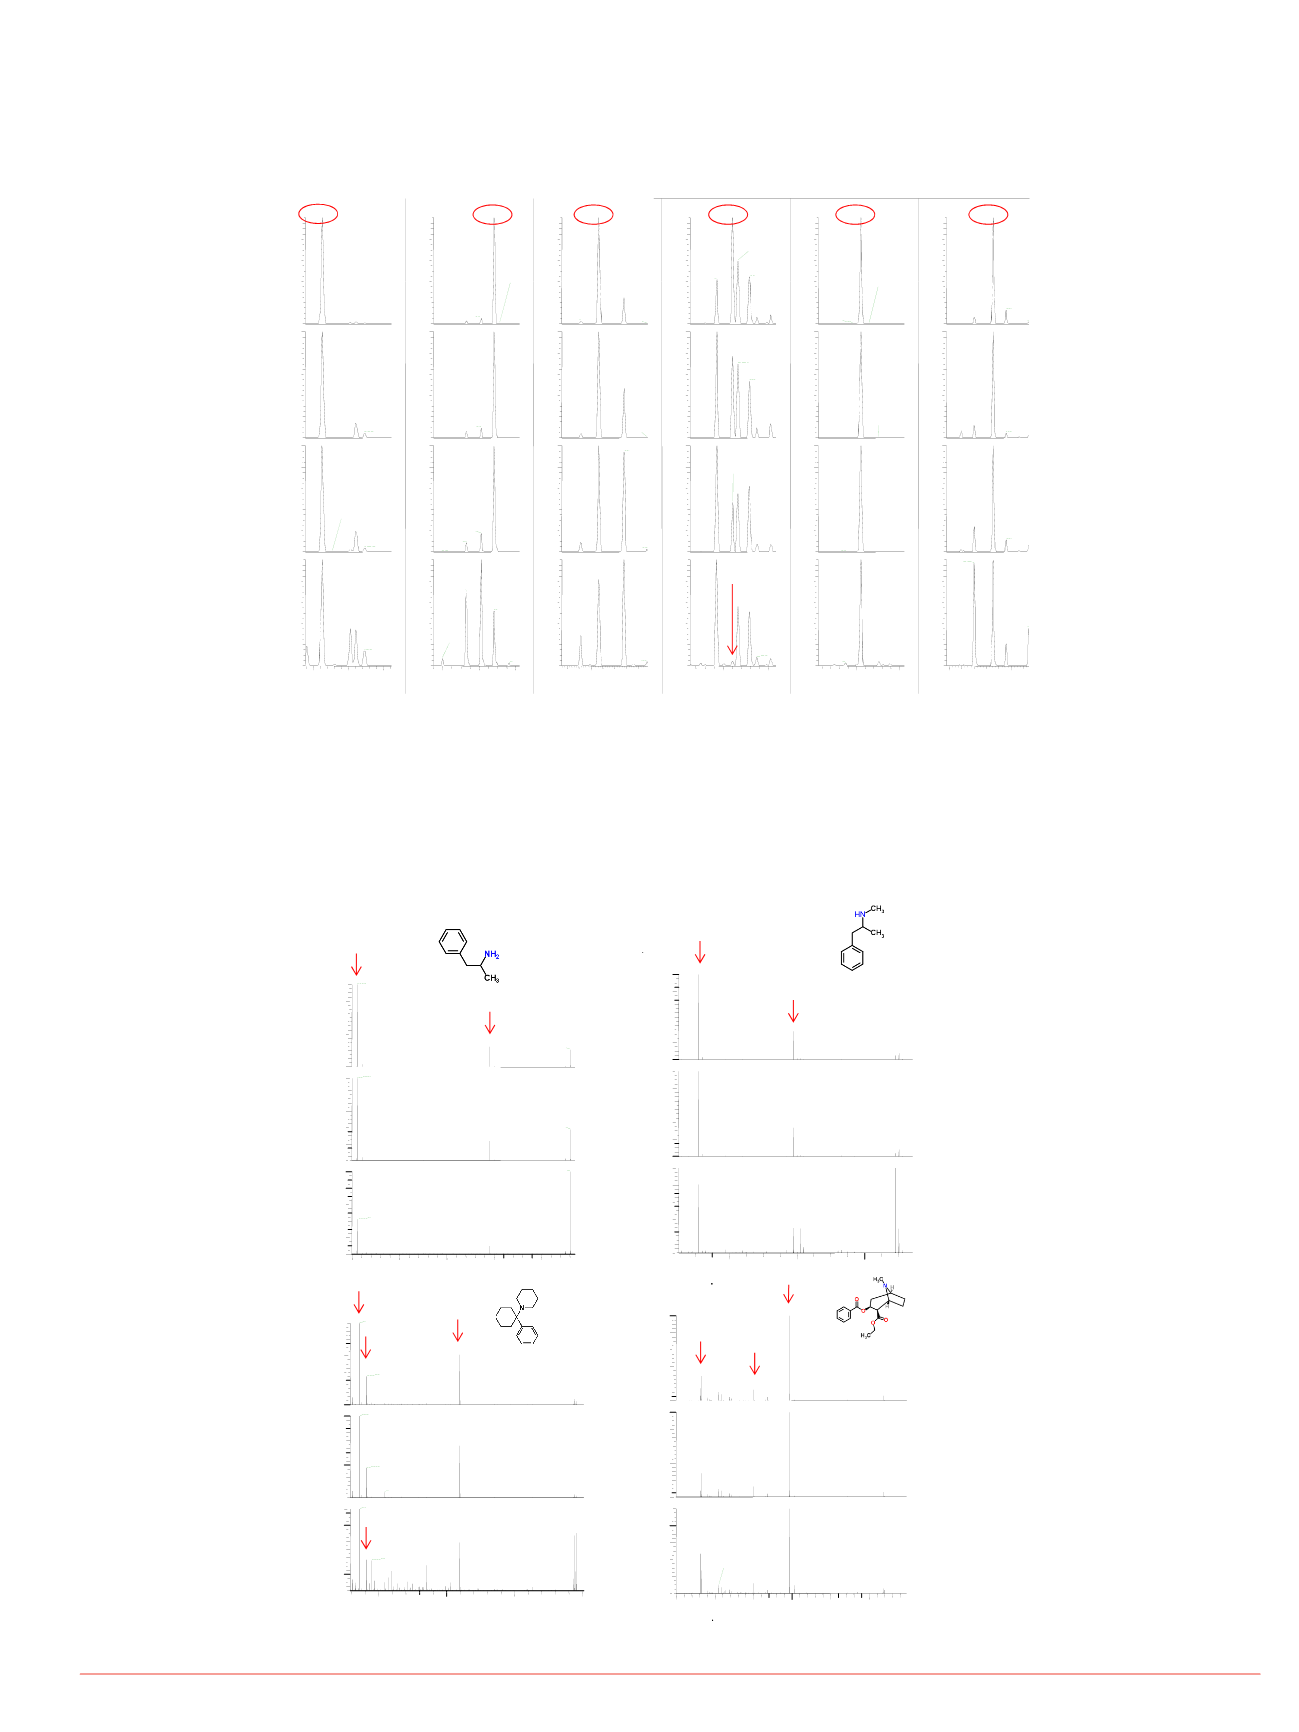
FIGURE 5. DD MS/MS fragmentation at the highest resolving power of 140,000
(FWHM at m/z 200) in the Q Exactive allows for sensitive detection. An enhanced
signal to noise ratio (as compared to MS/MS at 17,500 resolving power, data not
shown) is observed. Accurate mass on both precursor and fragments (4-5 ppm
and 1-3 ppm, respectively) are used for the identification of compounds in
• Any combination of user re
MS/MS, are allowed for the
• Accurate mass fragments (f
een <1 to 16% for drug in
spots.
w. Data processed in
ix are positively
tt
d th
screening applications.
Sample: mixture of six drugs analyzed from DBS, four shown below.
Concentrations noted in each panel.
a)
Amphetamine
b)
Methamphetamine
20
60
100 91.0544
119.0859
150 1280
NL: 1.78E7
matching are required to co
• We have demonstrated fea
expected concentrations ar
c pa ern an e
e Table).
er.
60
100 91.0544
119.0858
136 0736
NL: 5.86E6
1000 ng/mL
1000 ng/mL
20
60
100
.
91.0544
119.0859
150.1280
NL: 9.06E6
lower levels can be achieve
• High resolution and accurat
by MS and nicely complem
d i d bl
d t
20
60
100
20
.
91.0544
136.0736
119.0858
NL: 2.68E6
500 ng/mL
500 ng/mL
100
120
140
0
20
60
100
149.0237
91.0544
119.0858
NL: 1.59E6
r e oo spo s.
• Data collected in this scree
MS event is always acquire
90
100 110 120 130
0
20
60
100
136.0736
91.0543
119.0857
NL: 1.18E6
100 ng/mL
100 ng/mL
60
100
196.1336
82 0653
NL: 6.90E7
60
100 86.0966
159.1173
91 0545
NL: 4.33E7
• The paper spray technique
3.0 software provides a co
Isotopic pattern match
Simulation
c)
PCP
d)
Cocaethylene
References
1000 ng/mL
1000 ng/mL
20
60
100
20
.
150.0917
318.1704
196.1336
82.0653
150 0917
NL: 3.74E7
20
60
100
20
.
244.2064
86.0966
159.1172
91.0544
NL: 2.66E7
Experimental
1. Manicke, N.; Yang, Q.; Wa
Paper Spray Ionization for
300
, 123-129.
500 ng/mL
500 ng/mL
0
20
60
100
.
318.1705
196.1336
80.9480
150.0917
105.0337
318.1704
NL: 6.60E6
0
20
60
100
104.1071
244.2063
86.0966
245.1365
159.1172
95.0857 135.1171
213.1100
NL: 3.26E6
For forensic toxicology use o
All trademarks are the property of The
This information is not intended to enc
intellectual property rights of others
100 ng/mL
100 ng/mL
50 100 150 200 250 300
100
150
200
250
.


