
6
Compound Calibration Report
Lab Name:
Clinical Marketing
Page 1 of 2
Instrument:
TSQ Quantum Ultra
Method: 20110707_Opiods3
User:
Thermo Scientific
Batch:
20110707
Cali File: 20110707.calx
Linear
Pass
Level
Std Amount Std Area
IS Amount
IS Area
Response ratio Calc Amt Units
%CV
%RSD
20ng
20.000
367529
200
5101141
0.072
20.321 ng/mL
N/A
N/A
50ng
50.000
1045386
200
5315652
0.197
49.415 ng/mL
N/A
N/A
100ng
100.000
1852555
200
4608140
0.402
97.361 ng/mL
N/A
N/A
200ng
200.000
3991498
200
5038670
0.792
188.453 ng/mL
N/A
N/A
500ng
500.000
10944156
200
5208437
2.101
494.089 ng/mL
N/A
N/A
1000ng 1000.000
23026542
200
5408893
4.257
997.447 ng/mL
N/A
N/A
2000ng 2000.000
49792820
200
6004548
8.293
1939.607 ng/mL
N/A
N/A
5000ng 5000.000 136528195
200
5673787
24.063
5621.638 ng/mL
N/A
N/A
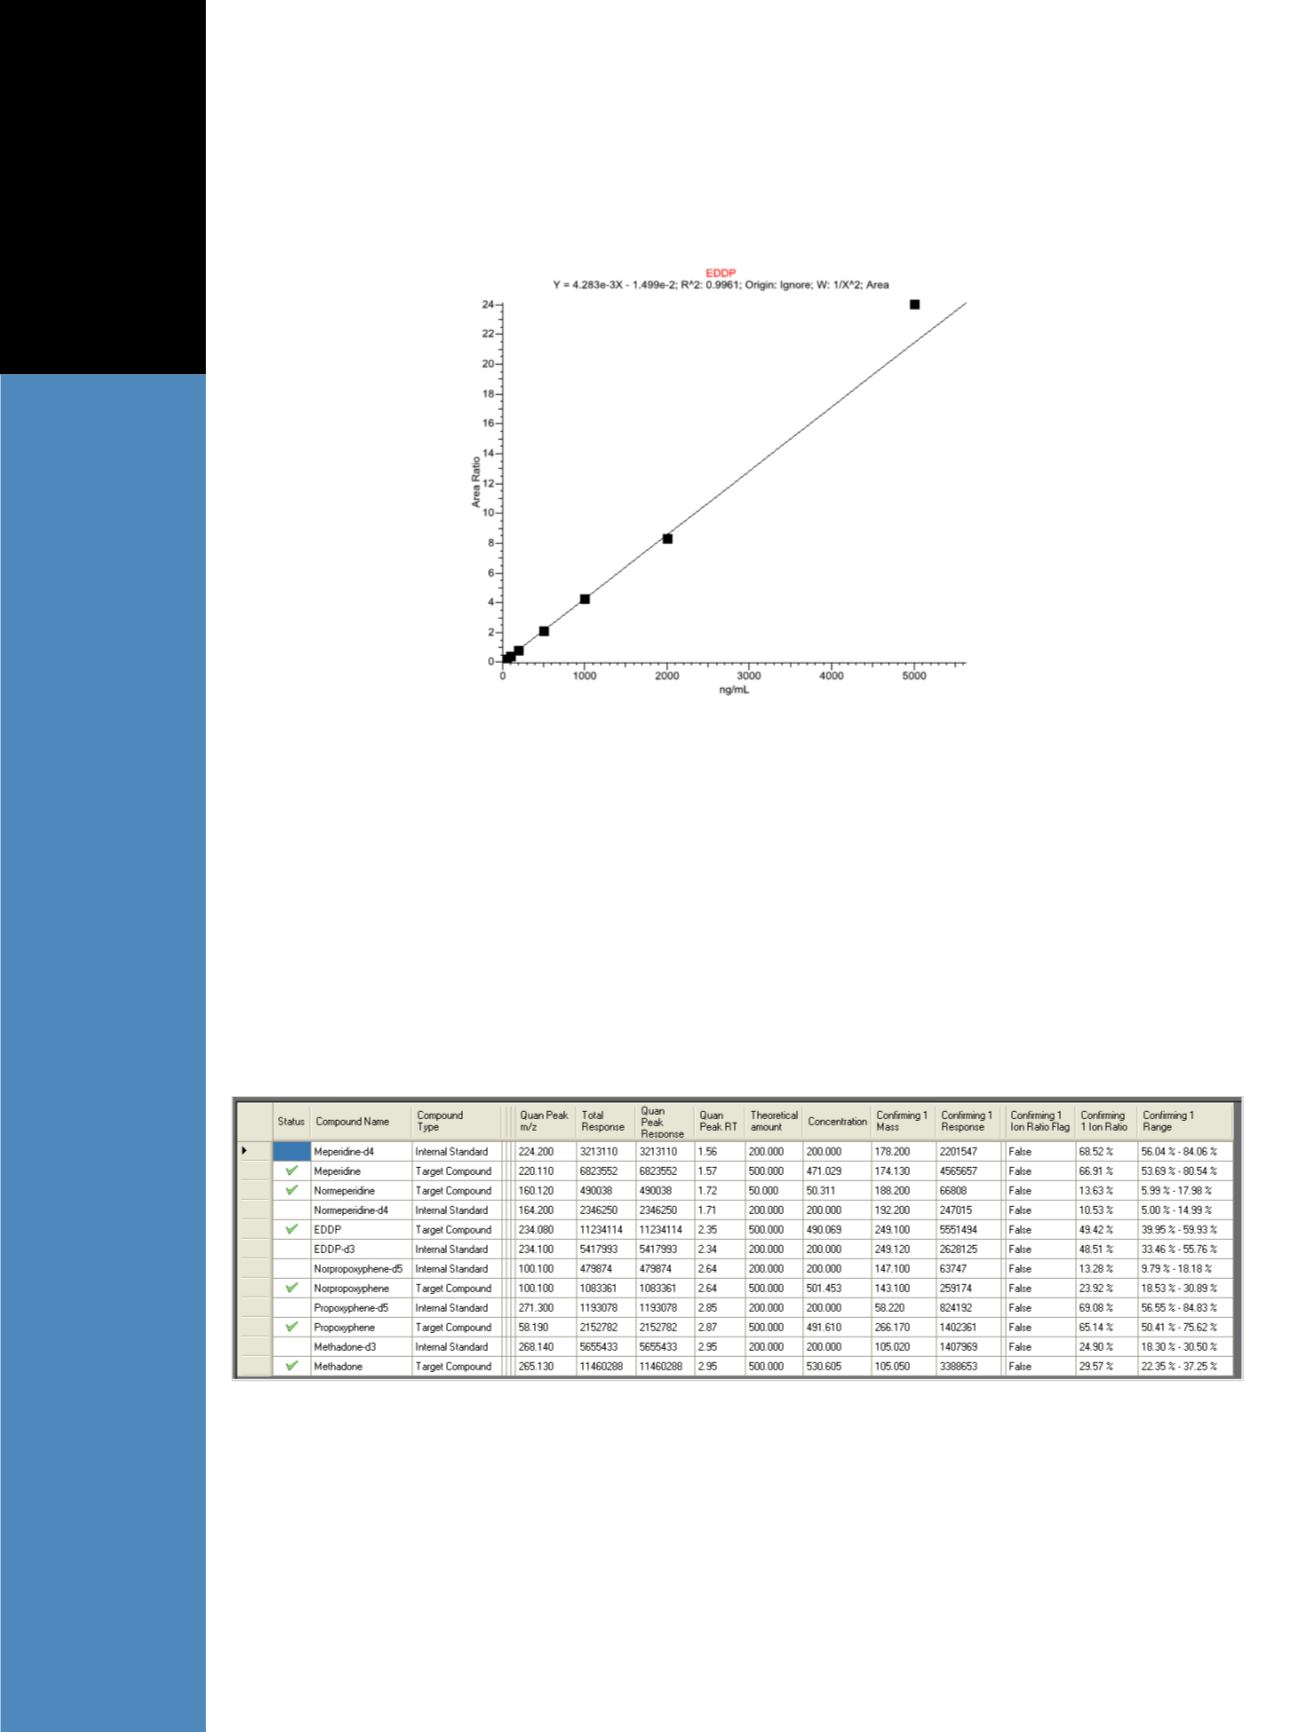
Figure 8. Compound Calibration Report for EDDP
Figure 9. Sample Report showing ion ratio confirmation


