
5
Thermo Scientific Poster Note
•
PN ASMS13_TP29_JDiBussolo_e 06/13S
Conclusion
Improved reliability and economy
research purposes by using a nov
Ion suppression of ISDs by co-
by using the short Accucore C
Using 1/x weighting, correlati
Cyclosporin A, from 25 t
Everolimus, Sirolimus &
Carryover, measured by peak a
injections following the highes
Reproducible ISD QC results w
evaluating this method with th
A reduction in solvent waste of
legacy TurboFlow methods for
Acknowledgement
The authors thank the following wh
laboratories:
Dr. William Clarke & Autumn Breaud
Dr. Mark Kellogg & Dr Roy Peake of
Dr. Sihe Wang & Jessica Gabler of th
m column:
ChromSystems 6PLUS1 and MassCheck are regis
Chemicals, GmbH. All other trademarks are the
This information is not intended to encourage u
infringe the intellectual property rights of other
For Research Use Only. Not for use in diagnostic
m column:
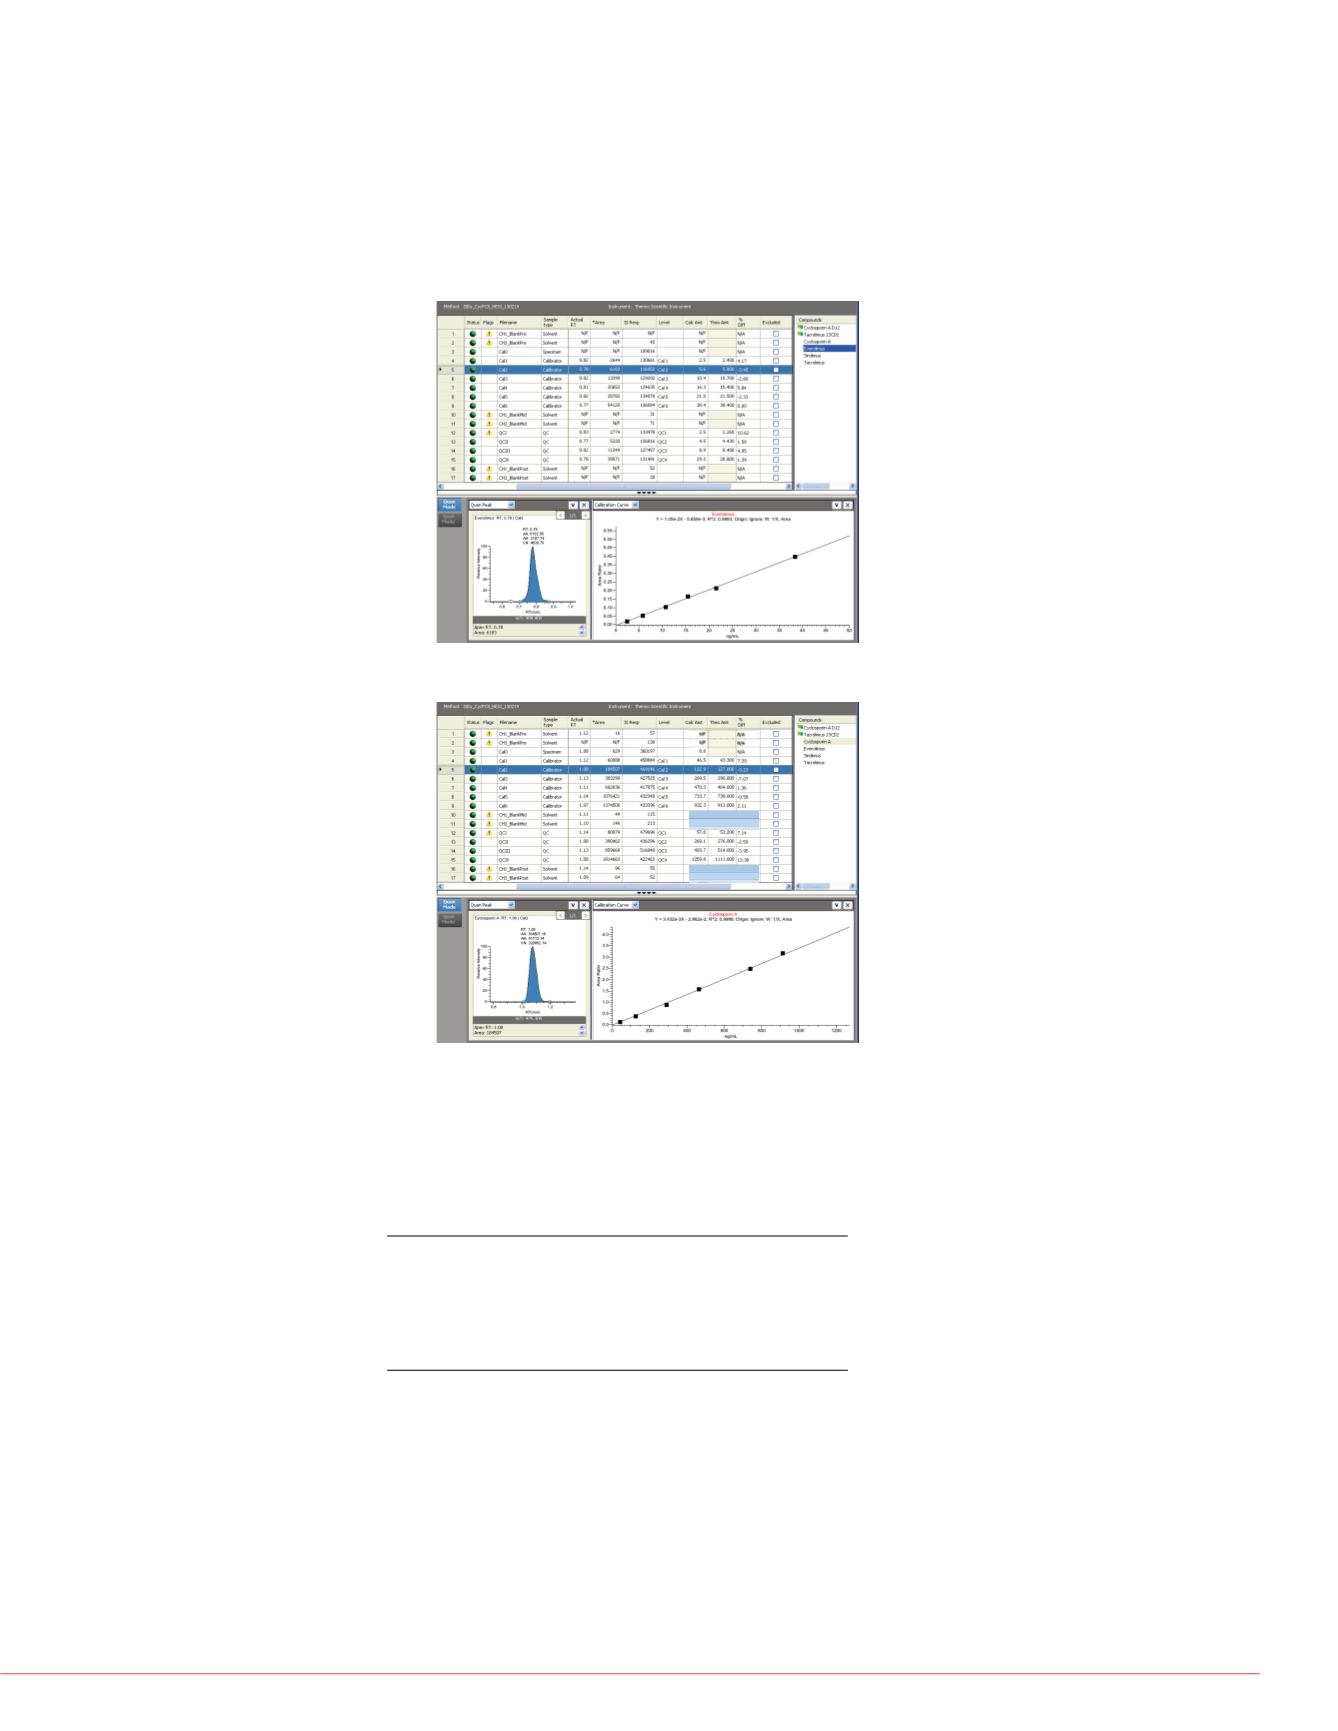
FIGURE 6. Everolimus Calibrators and QCs
Achieving Required Linear Range with No Significant Carryover
As shown in Figures 5 and 6, the method consistently showed linear responses
between 2.5 and 50 ng/mL for Everolimus, Sirolimus and Tacrolimus and
between 25 and 1,250 ng/mL for Cyclosporin A. Weighting the data by 1/x
minimized differences between expected and calculated concentrations in
calibrators.
that Minimize Interferences
ids and phthalates, all are
uring the TurboFlow process.
ed to elute the ISDs to the
ng co-elution of interferences
he HPLC column while
up and co-elution from non-
producibility (RSDs > 20%) of
hes. Figure 4 shows results
proved IS peak area
:Tacro IS (824>771)
:Tacro IS (825>772)
:CycloA
CycloA IS
:Dioctylphthalate
:Phosphotidylcholine;38:6
:CycloA
CycloA IS
FIGURE 7. Cyclosporin A Calibrators and QCs
Reproducible QC Results were Reported Across 3 Different Test Sites.
As shown in Table 1, very similar results were reported from three different
research test sites: Johns Hopkins University, Boston Children’s Hospital and
The Cleveland Clinic.
TABLE 1. Commercial Quality Control (QC) Reproducibility Results
n=15 from 3 systems within 30 days
Matching Results from Legacy Met
As shown in Table 2, the Prelude me
those produced by a legacy TurboFl
Prelude results were reproduced re
were almost 1 month old.
Repeat
Ran on 1/9/2013 1/29/20
Test
Legacy Prelude Prelud
Sample
ISD
Method Method Metho
8KLE Cyclosporin A:
86
105
8KBG Cyclosporin A:
186
201
8KOU Cyclosporin A:
84
99
8L20 Cyclosporin A:
80
81
8LB5 Cyclosporin A:
88
94
8JDF Cyclosporin A:
168
176
8I6C Cyclosporin A:
53
58
8KJNK
Sirolimus:
3.6
2.2
8KN6
Sirolimus:
3.0
1.2
8L5K
Sirolimus:
8.4
9.5
8JB0
Sirolimus:
3.3
3.5
8GOC
Sirolimus:
14.4
12.5
1
8I27
Sirolimus:
3.2
2.5
86HF
Sirolimus:
5.7
5.5
TABLE 2. Everolimus Calibrators a
CyclosporinA
Everolimus
Level
Expected Average RSD%
Expected Average RSD%
I
53
53 4.6
2.3
2.3 11.7
II
276
260 3.5
4.4
4.4 11.0
III
514
515 2.1
8.5
8.8 8.4
IV
1111 1172 6.4
28.8
28.6 6.1
Sirolimus
Tacrolimus
Level
Expected Average RSD%
Expected Average RSD%
I
2.9
2.9 8.5
2.6
2.8 5.3
II
10.1
10.0 4.6
7.3
7.1 6.1
III
20.4
20.6 5.2
16.7
16.4 4.1
IV
38.5
38.6 6.2
34.2
33.8 4.1


