
3
Thermo Scienti c Poster Note
•
PN63780_E 03/13S
paration liquid chromatography
s and fluidics configuration to
pplications.
high efficiency HPLC utilizing core
etry were optimized for
e and steroidal compounds.
r while conserving consumables
) sample results from three
ferent locations typically varied by
have a need for rapid and
easy-to-use and maintain. We
l HPLC pump design and fluidics
mple cleanup using TurboFlow
phy (HPLC) on two channels
bility, linearity, and other
s (immunosuppressant drugs
min D and various steroids in
significantly reduced solvent
ble results.
d 20 uL injections of supernatants
TurboFlow column, transferred
mn (2.1 x 50 mm) in which the
ystem.
S) with heated electrospray ion
ective reaction monitoring (SRM)
PLC-MS system and to collect
to determine inter- and intra-
re 1). Using a test mix of four
mine, in both aqueous and
SPLC systems were tested.
as retention times across
epresentative Pressure Trace.
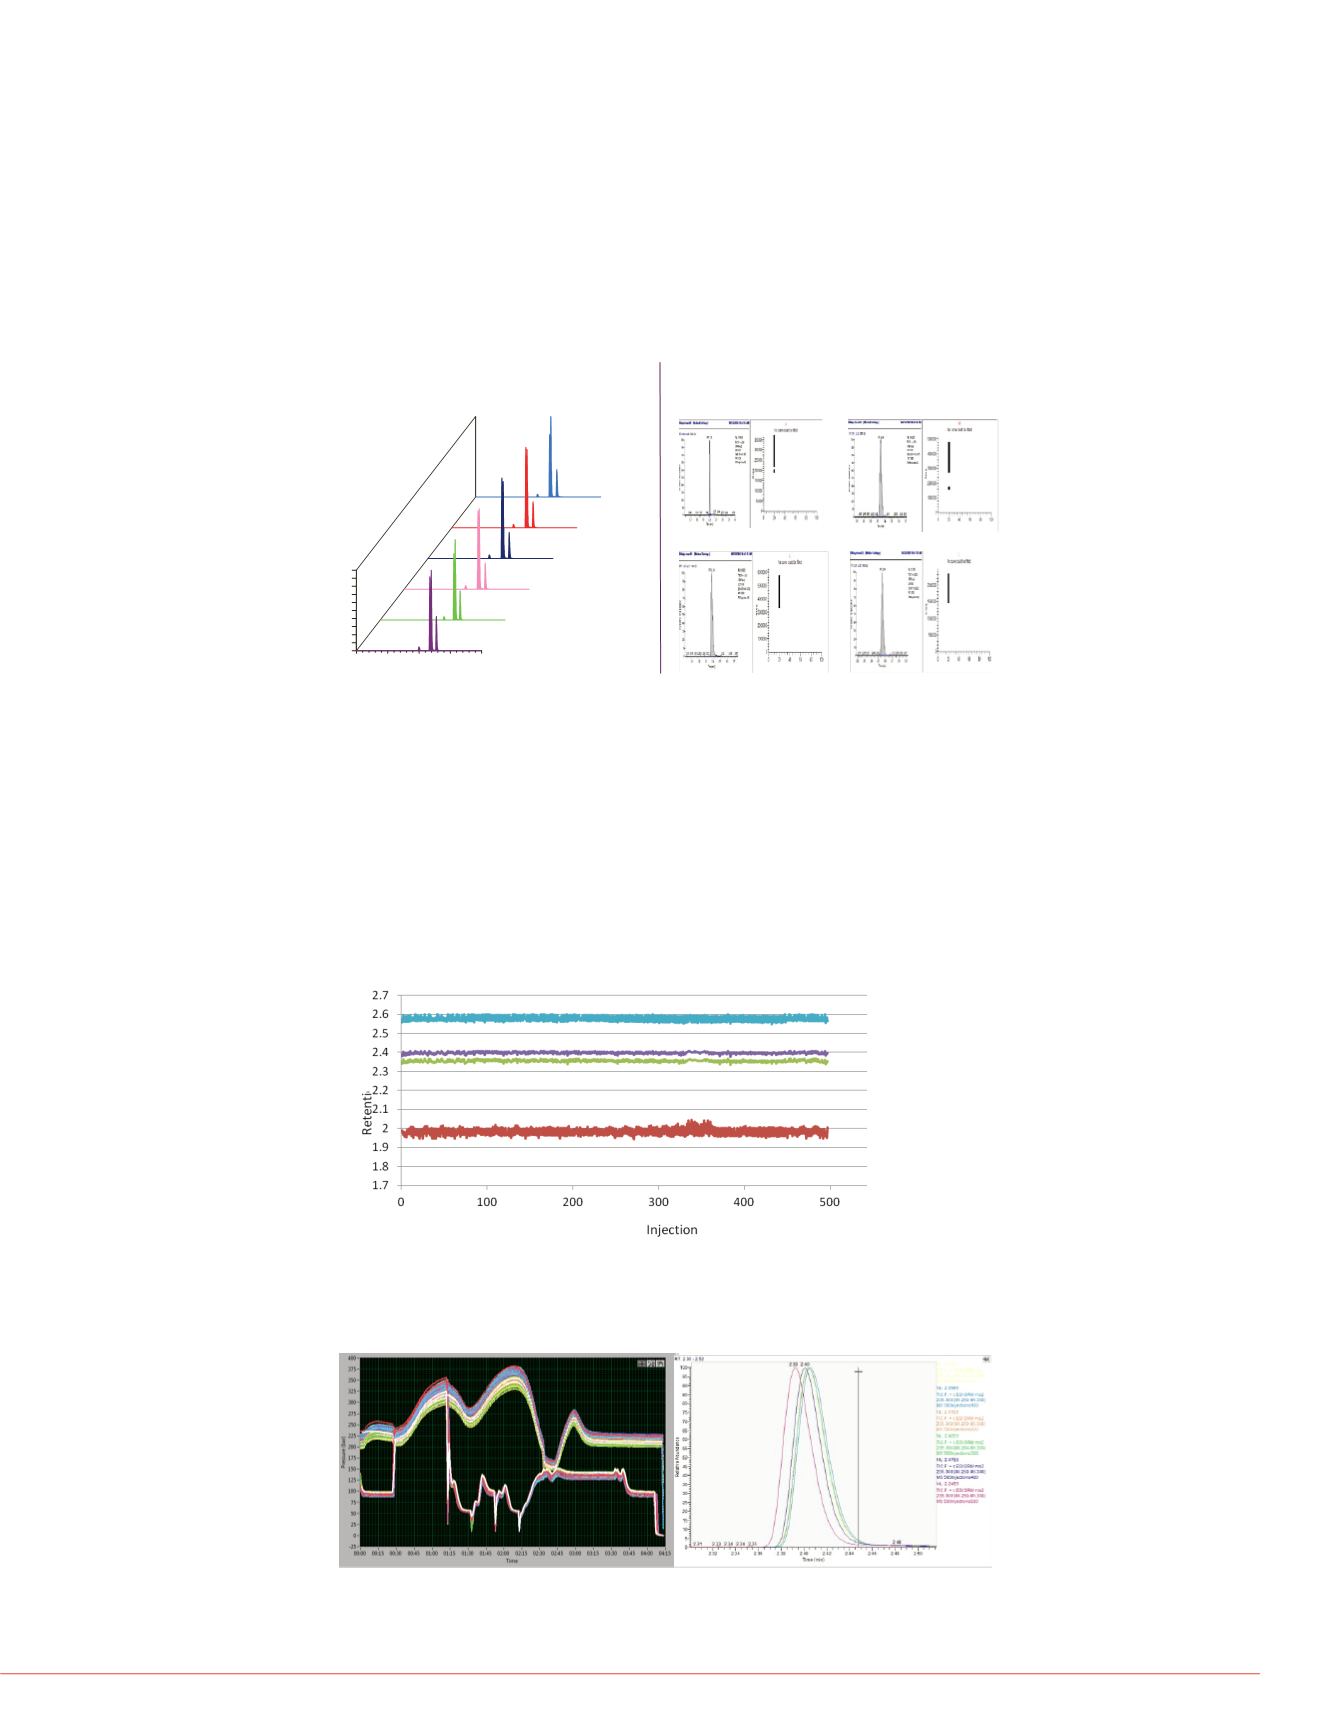
FIGURE 2. 500 Matrix Injections -
over 34 hrs of run time!
FIGURE 3. Peak Area %RSDs
Results
Whole-System Testing Verified Performance
To simulate a typical bio-analytical application, plasma spiked with our test mix was
mixed with a 3-fold volume of acetonitrile and centrifuged. To test the reproducibility
and ruggedness of the SPLC-MS/MS system, we ran a batch of 500 injections of the
supernatant, which had a duration of 34 hours. The peak retention times and areas for
each compound were reproducible as illustrated in Figure 2. Without the benefit of
smoothing or internal-standard compensation, peak area RSDs were below 9%
(Figure 3).
Inter-System Testing was Accep
While performance and ruggednes
single LC-MS system is essential, i
system performance is equally imp
The typical workflow from Develop
Production of a new method relies
system ruggedness and reproduci
this reason, data from three protot
SPLC systems were gathered over
course of 5 months of testing and r
time performance across the three
were analyzed. Reproducibility of r
times for each of the four test com
generated from both channels of t
systems is summarized in Figure
percent coefficient of variation (%C
values were calculated from A rand
selection of 9 data points for each
compound.
A Purpose-Built Method clearly
Knowing that a rigorous LC-MS m
test of the Prelude SPLC system,
chromatographic separations was
the first, Atenolol, the earliest elute
with the refocusing of analytes on t
shape differences in Warfarin and
may exist with gradient formation a
compositional mobile phase differe
degradation in peak shape if the m
prescribed by the method. In conc
The installation protocol for Prelud
pass 20 injections (10 per channel)
standard correction for retention ti
performance.
FIGURE 4. Retention Time Drift for four compounds over 34 hrs of run time
FIGURE 5. Pressure Trace Overlay across 34 hrs & Peak Overlay at injections
1,100, 200, 3 and 500
FIGURE 8. System Suitability ru
Pressure and Retention Times were Reproducible
While the reproducibility of raw area counts speaks to the removal of matrix effect and
its impact on data, the burden of 500 matrix injections and its impact on the aging of
the SPLC system and its columns can be significant. For that reason retention time
drift, pressure trace drift and peak shape changes were evaluated for the same data
set. As shown by Figures 4, 5 & 6, retention times, pressure traces and peak shapes
were remarkably stable throughout the 500-injection 34-hour batch.
mM ammonium formate + 0.05% formic acid
10 mM ammonium formate + 0.05% formic acid
nitrile + 45% isopropanol + 10% acetone
0
1
2
3
4
Time (min)
0
10
20
30
40
50
60
70
80
90
100
Relative Abundance
NL:
2.07E6
TIC MS
500injections
01
NL:
2.35E6
TIC MS
500injections
100
NL:
2.51E6
TIC MS
500injections
200
NL:
2.40E6
TIC MS
500injections
300
NL:
2.47E6
TIC MS
500injections
400
NL:
2.24E6
TIC MS
500injections
500
Imipramine
Lidocaine
Warfarin
Atenolol


