


 83 / 302

5
Thermo Scientific Poster Note
•
PN-64109-ASMS-EN-0614S
Conclusion
Quantitative results of PP
Semi-quantitative results,
PPCP by-products were o
Efforts to obtain analytical
References
1.
“The Determination of Em
Liquid Chromatography-T
Ministry of the Environme
laboratoryservicesbranch
2.
“Monitoring
the photoche
and sunlight using solid-p
M., Lores, M., García-Jare
65(8), pp. 1338-1347.
Acknowledgem
We would like to thank Dr. Vince
Ms. Renee Luniewski for providi
PPCPs
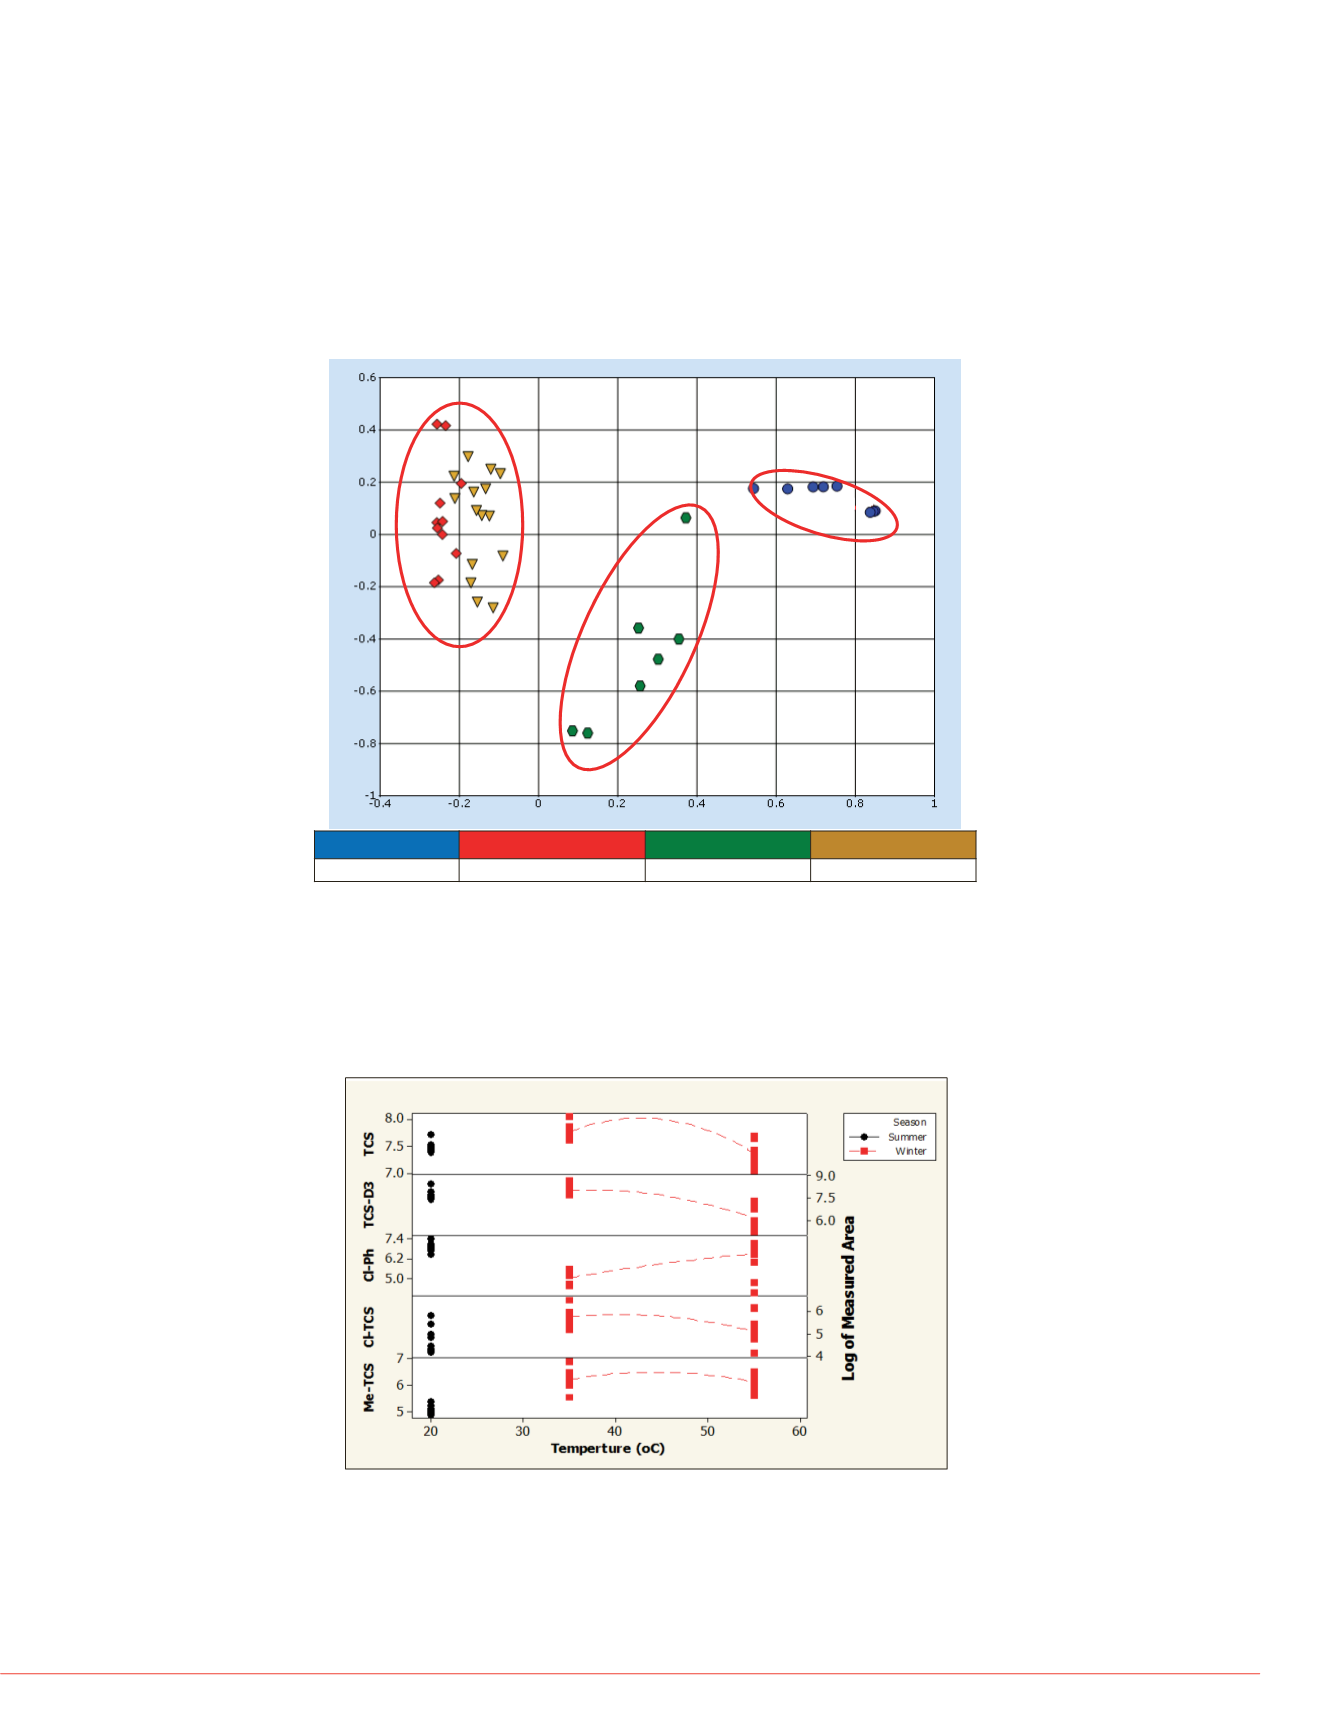
FIGURE 2. Overall effect of treatment temperatures
Semi-Quantitative Determination of PPCPs
In this presentation, TCS (antimicrobial agent) and CBZ (anticonvulsant drug) will be
used for the demonstration of by-product formation during wastewater treatment
processes. They are representative of pharmaceuticals and are the two most studied
groups of medicines. The effect of treatment temperatures and seasonal changes
were first investigated using principal component analysis. As shown in Figure 2,
scores for samples treated at 20
°
C (red, summer) and 55
°
C (brown, winter) were
similar; while scores for samples obtained from 35
°
C (green, winter) and standards
(blue) were quite different. An indication that treatment temperatures exerted more
effect on samples than seasonal changes.
Despite the vast number of TCS by-products proposed in the literature
2
, five
compounds (i.e., dichlorohydroxy-diphenyl ether, 2- and 4-chlorophenol (Cl-Ph),
methyl Triclosan (Me-TCS), and 4- and 5-chloro Triclosan, (Cl-TCS)). Semi-
quantitative concentrations of TCS, deuterium labelled TCS (TCS-D3), Cl-Ph, Cl-TCS
and Me-TCS are shown in Figure 3, indicating population of Cl-Ph were minimum
while other compounds reached their maximum at 35
°
C.
Concentration (ng/L)
Min
Max
Median
2.95E+02 2.52E+04 5.45E+03
6.96E+02 1.12E+04 2.52E+03
2.19E+02 1.81E+03 6.52E+02
1.75E+02 3.41E+03 6.48E+02
5.18E+01 9.29E+03 6.36E+02
4.56E+01 3.51E+02 1.27E+02
3.41E+01 3.24E+02 7.16E+01
1.16E+01 1.14E+02 3.12E+01
1.60E+03 2.80E+06 9.42E+03
3.52E+02 7.86E+05 8.03E+03
2.70E+00 2.08E+04 1.27E+03
1.91E+02 1.03E+03 4.33E+02
1.04E+01 1.27E+03 2.97E+02
2.07E+02 1.26E+05 3.30E+03
5.10E+00 1.64E+03 2.65E+02
7.89E+01 6.42E+03 1.62E+02
1.80E+00 1.43E+04 2.95E+02
4.64E+01 1.46E+03 2.75E+02
9.34E+02 5.76E+04 4.00E+03
2.69E+01 2.31E+04 6.57E+02
1.49E+01 1.25E+05 4.37E+03
urrence in the 35
25th-75th
Percentile
median
Standards
20
°
C, Sept 2012
35
°
C, Jan 2012
55
°
C, Jan 2013
Figure 3. Relative concentration of TCS and the three TCS by-products found
In comparison with other PPCPs
in this work. The unequivocal
challenge as many of these com
the same monoisotopic mass
reference standards, the chrom
structure with the most domin
concentrations of CBZ, deuteriu
found are shown in Figure 4.
Figure 4. Relative concentratio
Microsoft
®
and Excel
®
are trademarks of M
other trademarks are the property of Ther
Chemspider is a trademark of ChemZoo In
This information is not intended to encoura
intellectual property rights of others.