


 89 / 302

3
Thermo Scienti c Poster Note
•
PN ASMS13_T607_SWestrup_E 07/13S
e™ mass spectrometer was
ampler to do fully automated
mL sample volumes. Samples
r anthropogenic compounds in
hout time consuming solid
ices.
rn about potential
pogenic compounds and their
nature and public health. As a
t screening techniques for
traditionally carried out by
h high-resolution and accurate-
ic parameters and has the
mpounds of interest. A
ake it possible to acquire and
investigation side by side can
25 micrometer PTFE syringe
tions)
rmo Scientific Accela Open U-
column, 100 x 2.1 mm, 3.0
μm
with 5 mM ammonium formate
mL; Column Temp.: 25
°
C
Data Processing Tools
Thermo Scientific™
ExactFinder
™ software was used for fully automated data
processing of generated Full Scan MS + ddMS2 experiments for targeted screening
approaches with a simple four-click procedure. Additional features like Isotopic Pattern
Match, customized compound data stores and spectral libraries have been applied to
find compounds of interest. High-resolution, accurate-mass data files are open to
retrospective data analysis also by other software such as Thermo Scientific™
SIEVE™, Thermo Scientific™
MetWorks
™, Thermo Scientific™ Mass Frontier™
softwares as well as a ChemSpider
™ (
ChemZoo Inc, Wake Forest North Carolina)
search based on elemental composition proposals from present accurate-mass
signals. With these software tools, it was possible to drive investigation in different
directions simultaneously with a single injection of a sample set. Therefore, it is
recommended to have a second data set ready. This can be generated by using a
combination Full Scan MS + All Ion Fragmentation MS2 experiment to have full
information for possible fragments as well.
Results
Mapping the Water Cycle in SIEVE Software
The sampling area comprised several locations within a few square miles around a
waste water plant (WWTP): Water works, drinking water drainage area, WWTP with its
catchment area, and a receiving water course in an area where hospitals are located.
To show the impact of a WWTP to downstream waterways including waterworks,
SIEVE software has been used to monitor 70 compounds of interest, which are known
pollutants to drinking water sources like Carbamazepine, Phenazone, Simazine, and
Tramadol. These are known to be persistent in the environment and could be used as
tracer substances.
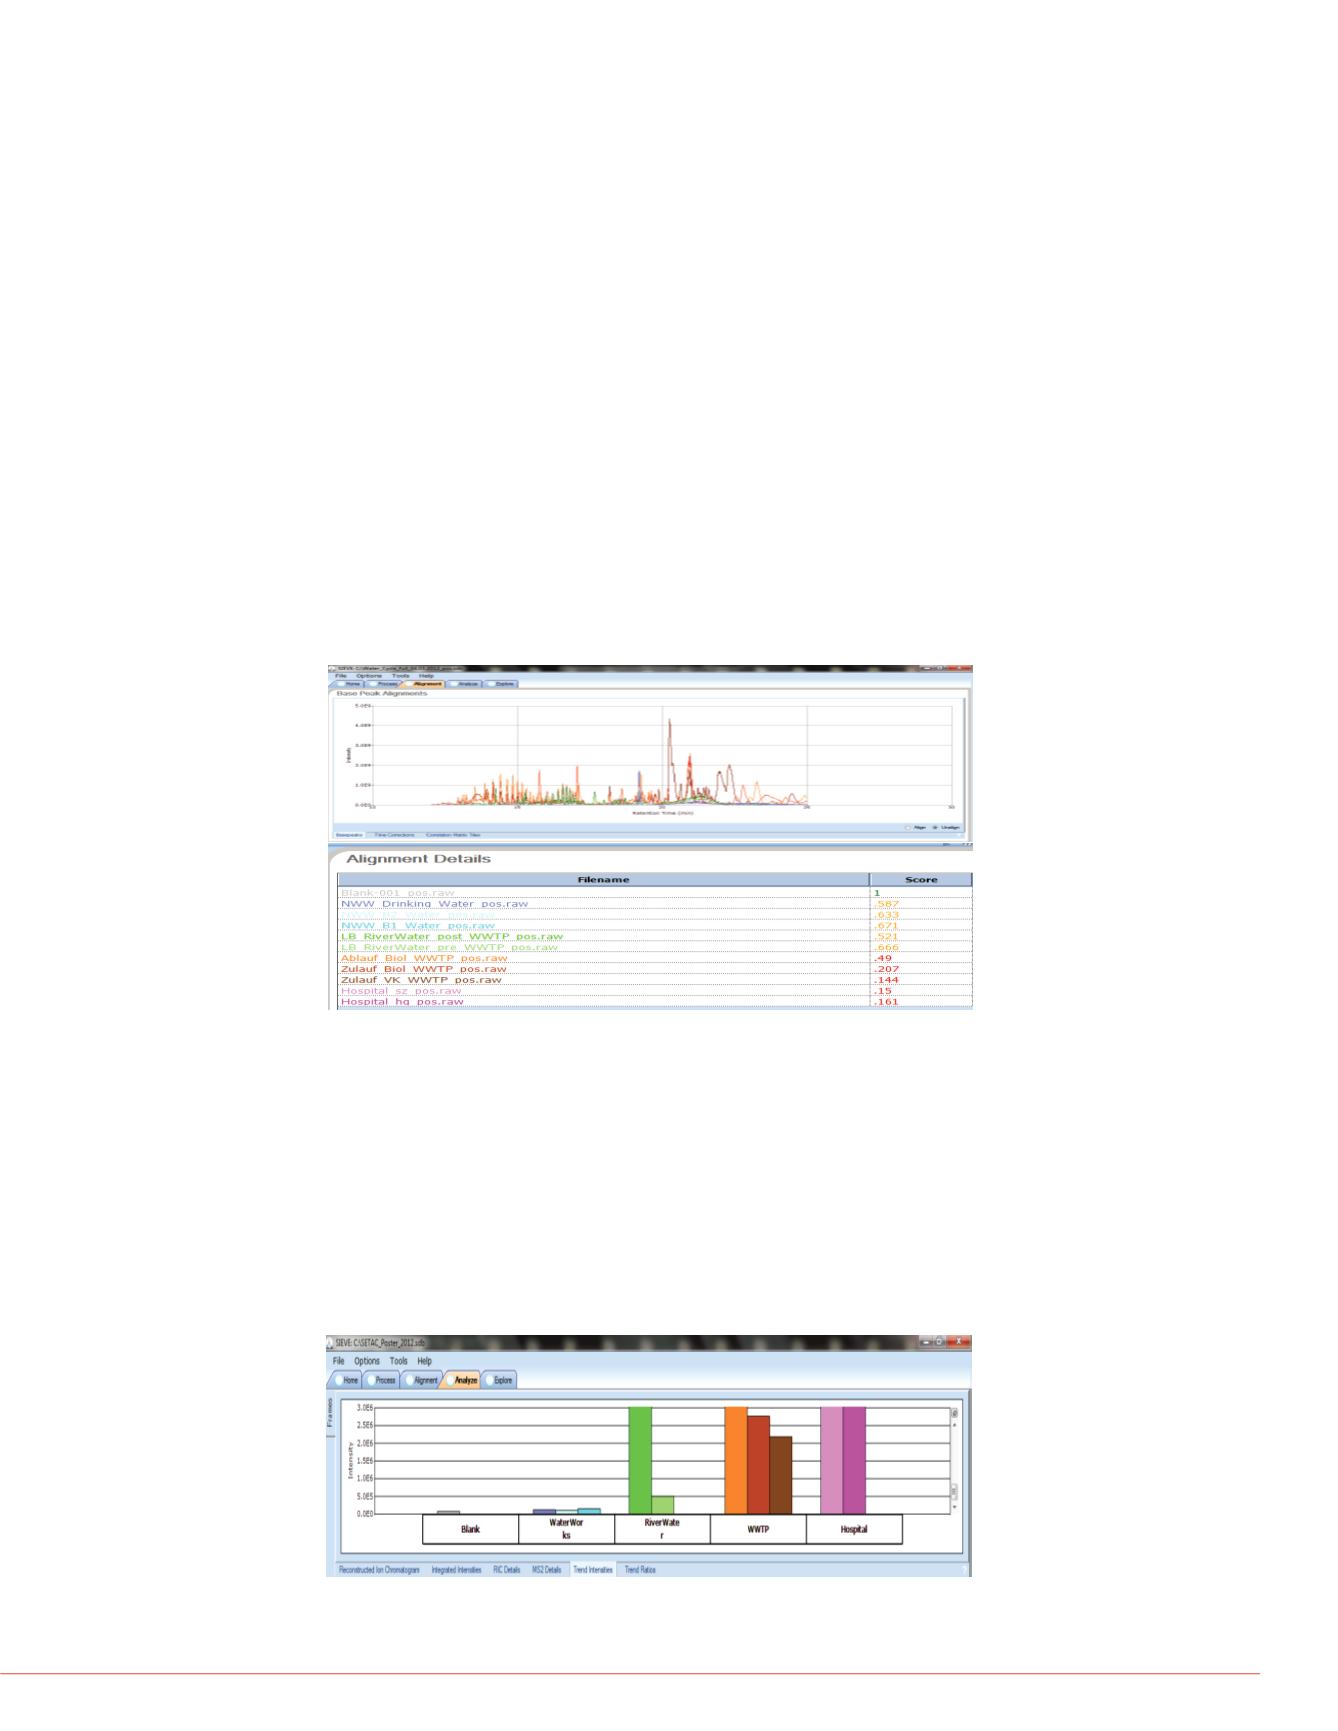
By applying differential analysis to samples from the different locations (Figure 1) we
get first information about the sample’s characteristics when we set the blank as a
reference. In terms of having similar score levels the locations are well aligned. Trend
comparison of the compounds of interest within the different locations has been
generated and a visual display of the samples is shown as overlapped
chromatograms. SIEVE performs background subtraction and framing before
identification of the compounds in the different samples
.
Figure 2 shows the heavy pollution impact of the waste water treatment plant effluent
to its receiving water course. Carbamazepine passed through
the WWTP into the
receiving water course towards the water works. In Figure 3, the performance of
SIEVE and its automatic background subtraction is shown in detail. This feature is
helpful in terms of showing the impact of the WWTP effluent to its receiving water
course by having instrument background noise eliminated as well.
FIGURE 1. Sample Characteristics Comparison
FIGURE 2. Location Survey of Carbamazepine
River wate
River water
Reference
“Th
FIGURE 3. Data processing receivi
Identify, Confirm & Quantitate in E
ExactFinder software was used to ext
confirmation and quantitation in a sin
set retention time and exact mass an
spectral library matching using ddMS
the method setup is shown in Figure
FIGURE 4. ExactFinder Method Se