


 91 / 302

5
Thermo Scienti c Poster Note
•
PN ASMS13_T607_SWestrup_E 07/13S
Conclusion
The presented data was based
ddMS2 experiments for targeted
tasks it is recommended to gene
This gives access to fragment in
Because, ddMS2 experiments a
masses which have to be investi
Exactive inclusion list files can b
single mouse click.
ExactFinder software coupled wi
quantitative, confirmation and sc
data analysis. New features like
library comparison algorithm su
information of interest.
By using SIEVE, we could gener
investigation and mass balance
compatible.
ChemSpider is a registered US trademark
currently provided by the Royal Society of
Switzerland. All other trademarks are the
This information is not intended to encour
intellectual property rights of others.
Acknowledgem
The authors wish to thank to AH
Germany, for providing samples
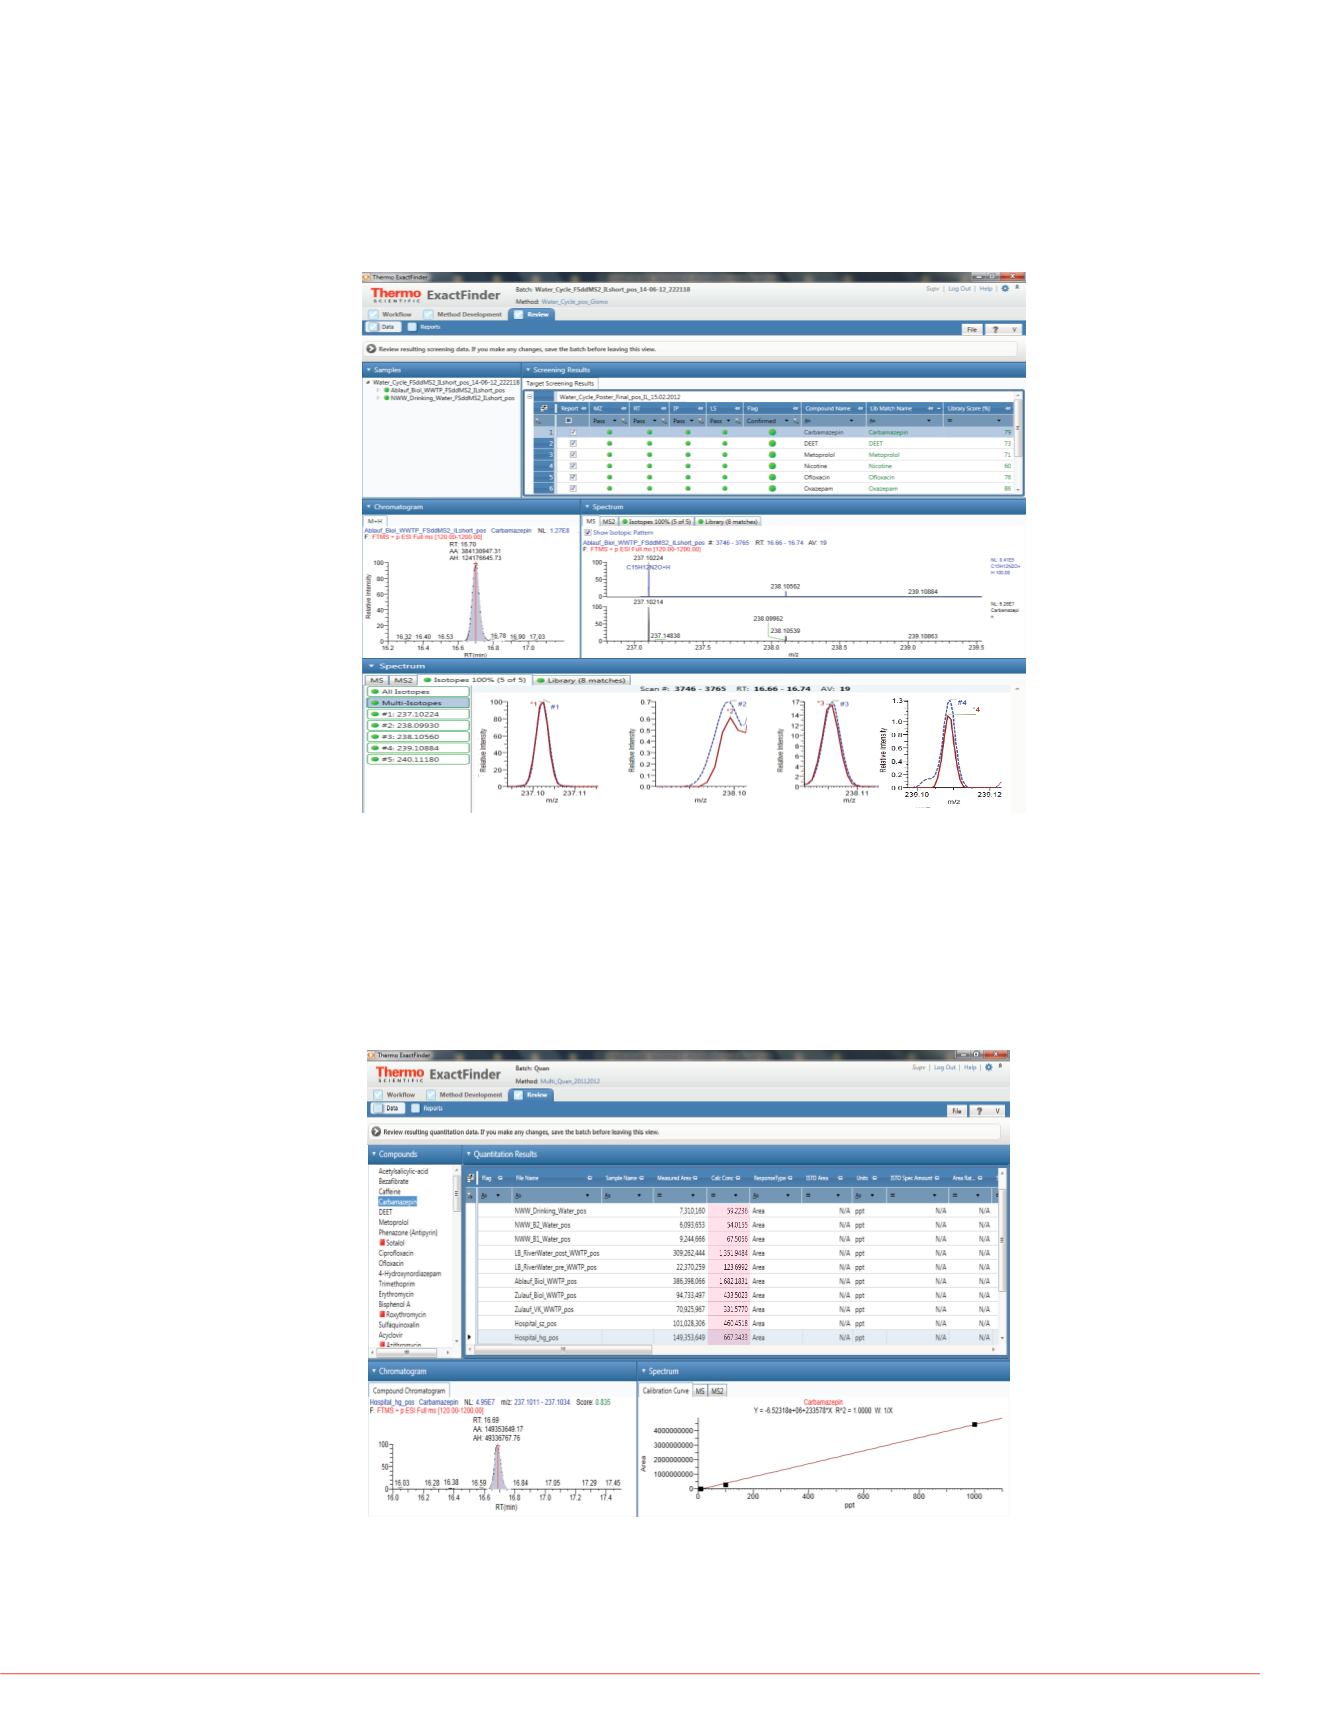
FIGURE 5. Targeted Screening & Isotopic Pattern Match with ExactFinder
FIGURE 8. Cleaner Spectra th
The quantitation table in Figure 6 gives an overview about present concentration levels of
Carbamazepine within the investigated water cycle from the hospital, WWTP, downstream
water ways and drinking water facilities. In drinking water samples concentrations of 54
and 59 ppt has been calculated based on Full Scan MS experiment data. The calibration
curve shows linear regression from 10 to 1000 ppt.
Figure 7 shows the confirmation of Carbemazepine by comparison to the Spectral Library.
ffluent (Reference)
ffluent (Background)
round:
t”
ple (background subtraction)
oftware
raw data information for both
g step. The processing method has
tern as identification criteria and
confirmation criteria. An example of
FIGURE 7. Spectral Library C
FIGURE 6. Quantitation of Carbamazepine from the Full Scan MS experiment
In Figure 8, the ddMS2 spectra i
spectra. Both scans was genera
filters the precursor ion before fr
confirmation against spectral libr
applied based on this.
In Figure 5, the extracted information for identification of Carbamazepine is shown as
an XIC (5 ppm). Isotopic pattern match in the new visualization mode was used as an
identification criteria in addition to accurate mass and retention time checked against
standard samples.