


 97 / 302

3
Thermo Scientific Poster Note
•
PN63619_E 06/12S
n
t.
)
ht
c
n
,
s.
r
.
,
.
Results
Quantitation
Acquisition and quantitation was carried out using TraceFin
theoretical mass of each protonated antibiotic compound w
quantitation in this analysis. Calibration lines were created
with either a linear or quadratic curve. Each calibration lev
to the large concentration range of the standards, some co
linear calibration lines, and were fitted with a quadratic fit.
weighting. An example calibration line for the compound su
Figure 2. The chromatogram shown in Figure 2 correspond
level, 3 pg/mL.
Mass Spectrometry
The Exactive™ Plus Orbitrap mass spectrometer was used in this experiment. The
Exactive Plus was operated in alternating full scan and all ion fragmentation (AIF)
mode with positive electrospray ionization. One scan of full scan MS data was
collected, and subsequently, all of the ions entering the MS were fragmented in the
higher-energy C-trap dissociation (HCD) collision cell at a collision energy (CE) of
30 eV with a 20% stepped CE, and analyzed in the Orbitrap mass analyzer. The
resolution for the full scan experiment was 70,000 and the resolution of the AIF
experiment was 35,000. The mass range 150-1000 amu was monitored in full scan,
and 80-1000 amu in the AIF experiments.
Data Analysis
Data was collected and analyzed using Thermo Scientific TraceFinder 2.1 software.
Spectral confirmation was carried out with Thermo Scientific ExactFinder, 2.0 software.
Limits of Quantitation
The limit of quantitation (LOQ) was determined by the lowe
group with a %RSD of less than 15%. The LOQ for this ex
Table 2. The %RSD for each compound at its LOQ is inclu
cases, the LOQ was lower than the concentration of the lo
Time
(min)
Loading Pump
%A
Flow Rate
(
µ
L/min)
Time
(min)
Analytical Pump
%A
Analytical Pump
%B
Flow Rate
(
µ
L/min)
0.0
100
1000
0.0
98
2
350
1.3
100
1000
1.5
98
2
350
1.5
100
100
3.0
70
30
350
12.0
100
100
8.0
2
98
350
12.1
100
1000
9.0
2
98
350
15.0
100
1000
9.1
98
2
350
15.0
98
2
350
TABLE 1. HPLC gradients for the loading and analytical pumps in the method
FIGURE 2. TraceFinder screen shot for the quantitation
sulfamerazine at 3 pg/mL
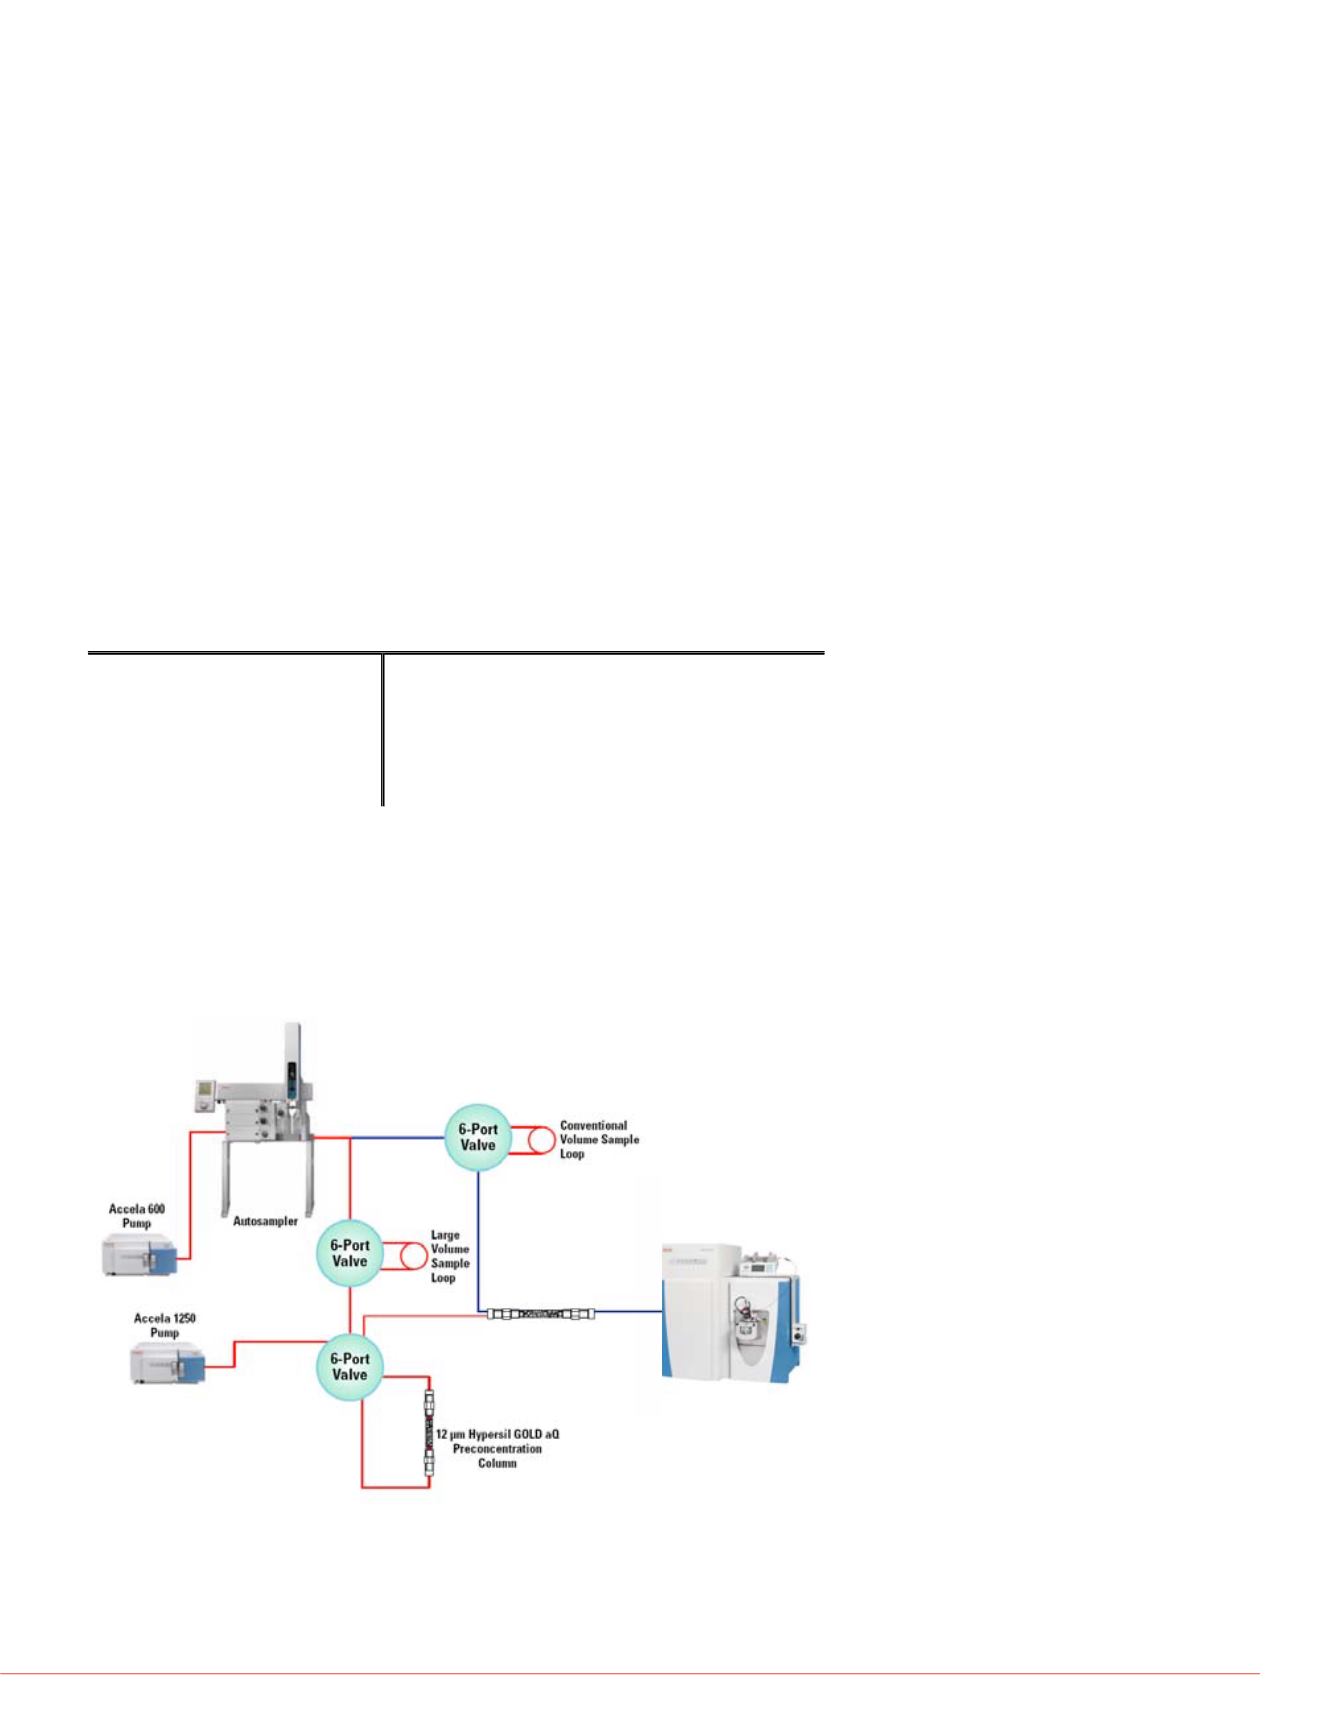
FIGURE 1. EQuan MAX system flow schematic
2.6 mm Accucore aQ
Analytical Column
Exactive Plus Orbitrap
Mass Spectrometer