


 98 / 302

4
High Resolution LC-MS for Screening and Quantitative Analysis of Antibiotics in Drinking Water Using an Orbitrap and Online Sample Preparation
Results
Quantitation
Acquisition and quantitation was carried out using TraceFinder™ software. The
theoretical mass of each protonated antibiotic compound was used as the mass for
quantitation in this analysis. Calibration lines were created for each compound, and fit
with either a linear or quadratic curve. Each calibration level was run in triplicate. Due
to the large concentration range of the standards, some compounds exhibited non-
linear calibration lines, and were fitted with a quadratic fit. All calibrators used a 1/X
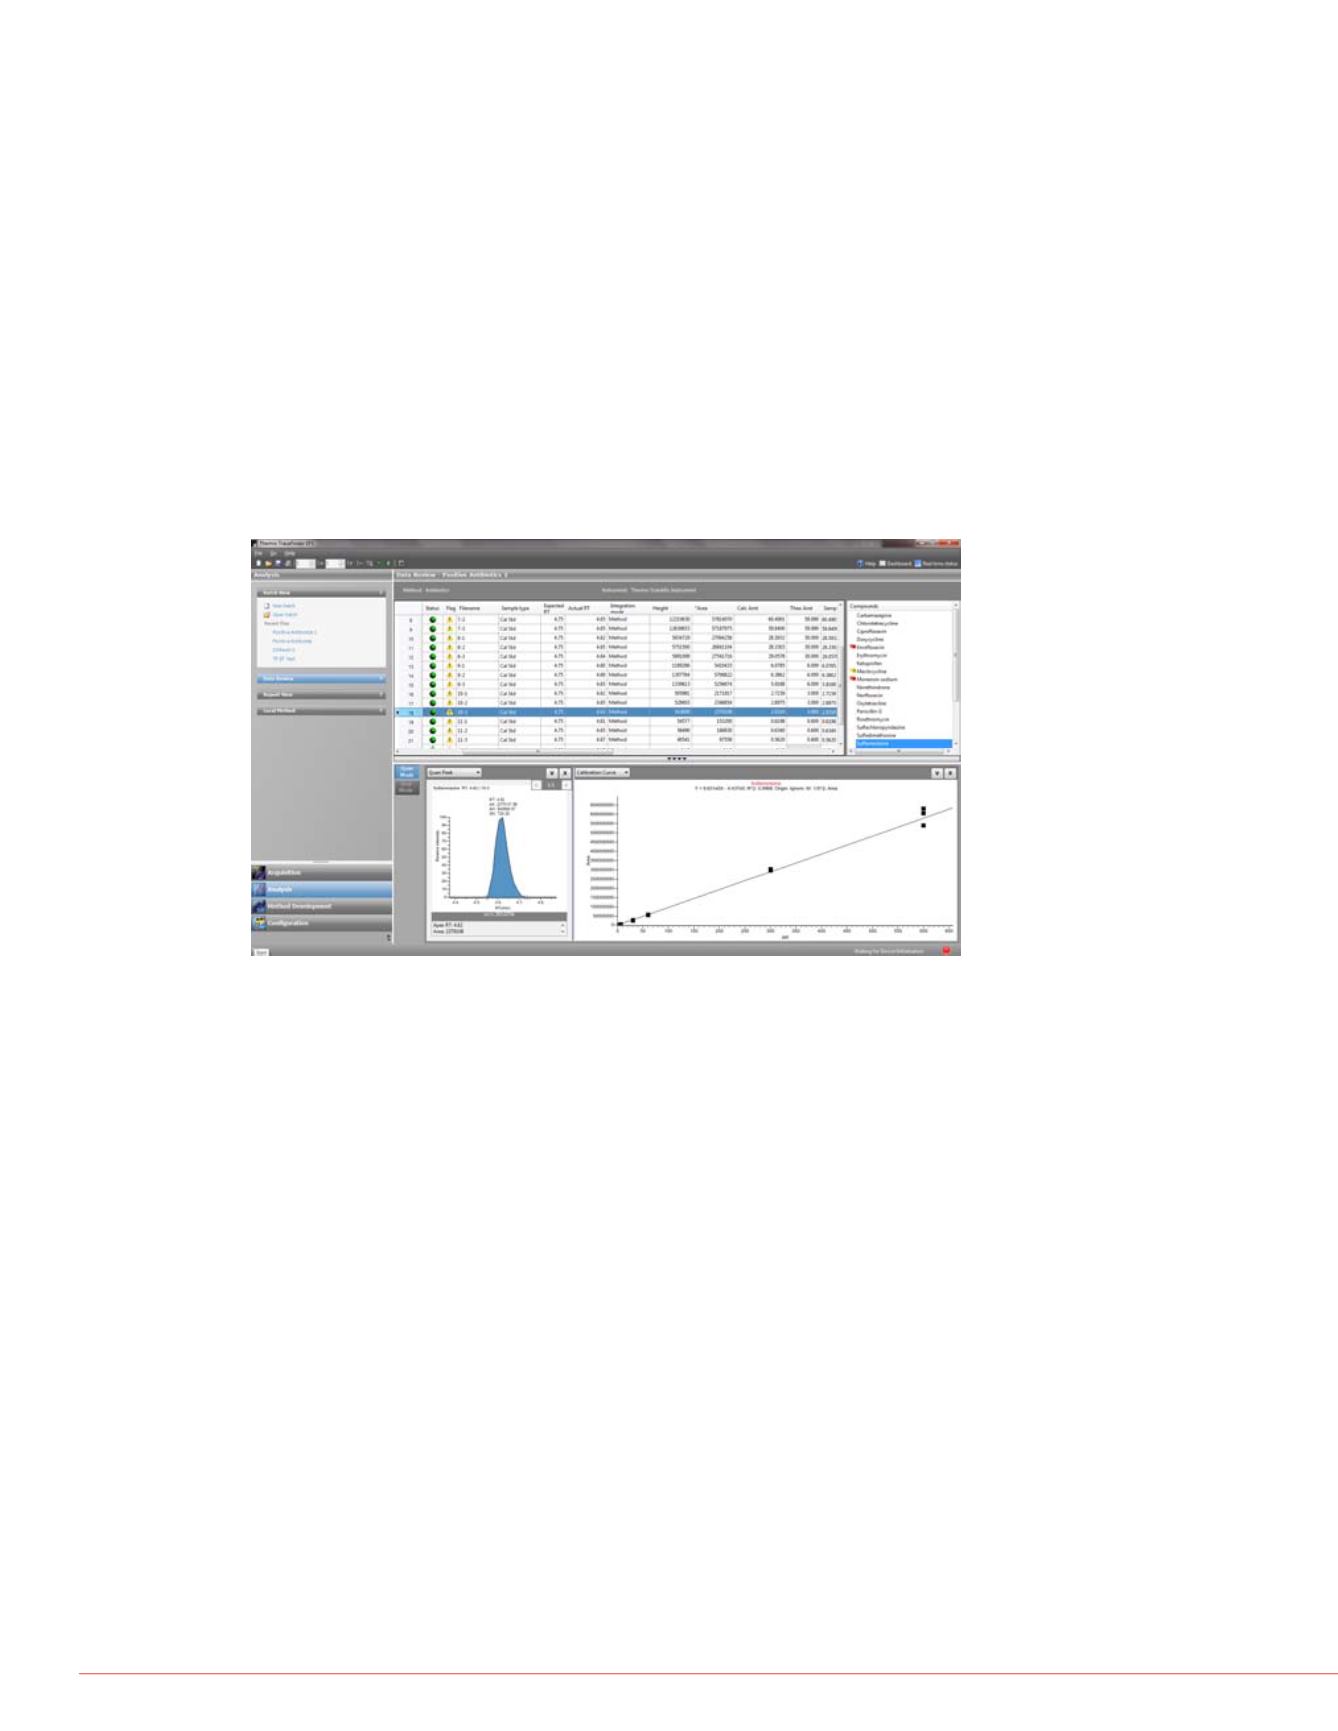
weighting. An example calibration line for the compound sulfamerazine is show in
Figure 2. The chromatogram shown in Figure 2 corresponds to the second to lowest
level, 3 pg/mL.
experiment. The
mentation (AIF)
S data was
ragmented in the
energy (CE) of
analyzer. The
ion of the AIF
itored in full scan,
nder 2.1 software.
tFinder, 2.0 software.
Limits of Quantitation
The limit of quantitation (LOQ) was determined by the lowest calibration standard
group with a %RSD of less than 15%. The LOQ for this experiment is shown in
Table 2. The %RSD for each compound at its LOQ is included in Table 2. In some
cases, the LOQ was lower than the concentration of the lowest calibration standard.
Spectral Confirmation
To add additional confirmation to the ant
confirmation of the MS
2
spectrum collec
ExactFinder™ software. Samples were
MS
2
spectra were searched against the
Clinical Research spectral libraries. The
Orbitrap instruments. Because all Orbitr
compatible, they provide identical spect
The spectral match for the antibiotic tri
comparison is from the HCD MS
2
spectr
to a concentration of 80 pg/mL. The top
The bottom spectrum is the collected sa
spectrum is cleaner, because it was coll
Orbitrap mass spectrometer by direct in
no co-eluting peaks, or matrix to genera
spectra match in the main fragment pea
m/z
= 291.1446 amu. This spectral confi
false-positives, and can be used for ide
lytical Pump
%B
Flow Rate
(
µ
L/min)
2
350
2
350
30
350
98
350
98
350
2
350
2
350
in the method
FIGURE 2. TraceFinder screen shot for the quantitation of the antibiotic
sulfamerazine at 3 pg/mL
Exactive Plus Orbitrap
Mass Spectrometer
TABLE 2. List of antibiotics analyze
reproducibility
Compound
Theoretical
Carbamazepine
332.1
Erythromycin
734.4
Ketoprofen
255.1
Norethindrone
299.2
Roxithromycin
837.5
Sulfachloropyridazine
285.0
Sulfadimethoxine
311.0
Sulfamerazine
265.0
Sulfamethazine
279.0
Sulfamethizole
256.0
Sulfamethoxazole
254.0
Sulfathiazole
271.0
Trimethoprim
291.1