


 82 / 302

4
Quantitative and Semi-Quantitative Determination of PPCPs and Their By-products in Wastewater Treatment Plants Samples Using UHPLC-Orbitrap MS
and Data Mining Technologies
separations were used for the
he analysis
tive Plus™
Orbitrap MS using
rbitrap MS system was tuned
n of standard mixtures of
used in the ESI source (35
ositive and negative modes.
wer of 140000 (defined as full-
sulting a scanning rate of >
of 1.0 x 10
6
and a C-trap inject
sed to perform quantitative
used to perform non-targeted
consisting of pharmaceutically
hormones, surfactants and
to search for adduct ions
nd (M-H)
−
molecular ion in the
The software then creates an
tion window (MEW) of 5 ppm.
C area threshold of 50,000
und), a 5 ppm mass accuracy
peaks ((M+1) and (M+2)), and
values. Typical screening time
base. Results obtained from
ientific™
SIEVE
™
software to
analysis was carried out using
prised of pharmaceuticals like
ID); as well as personal care
nts (Table 2). Antibiotics (e.g.
edian concentration compared
highest median concentration
ce this group only has one
usion.
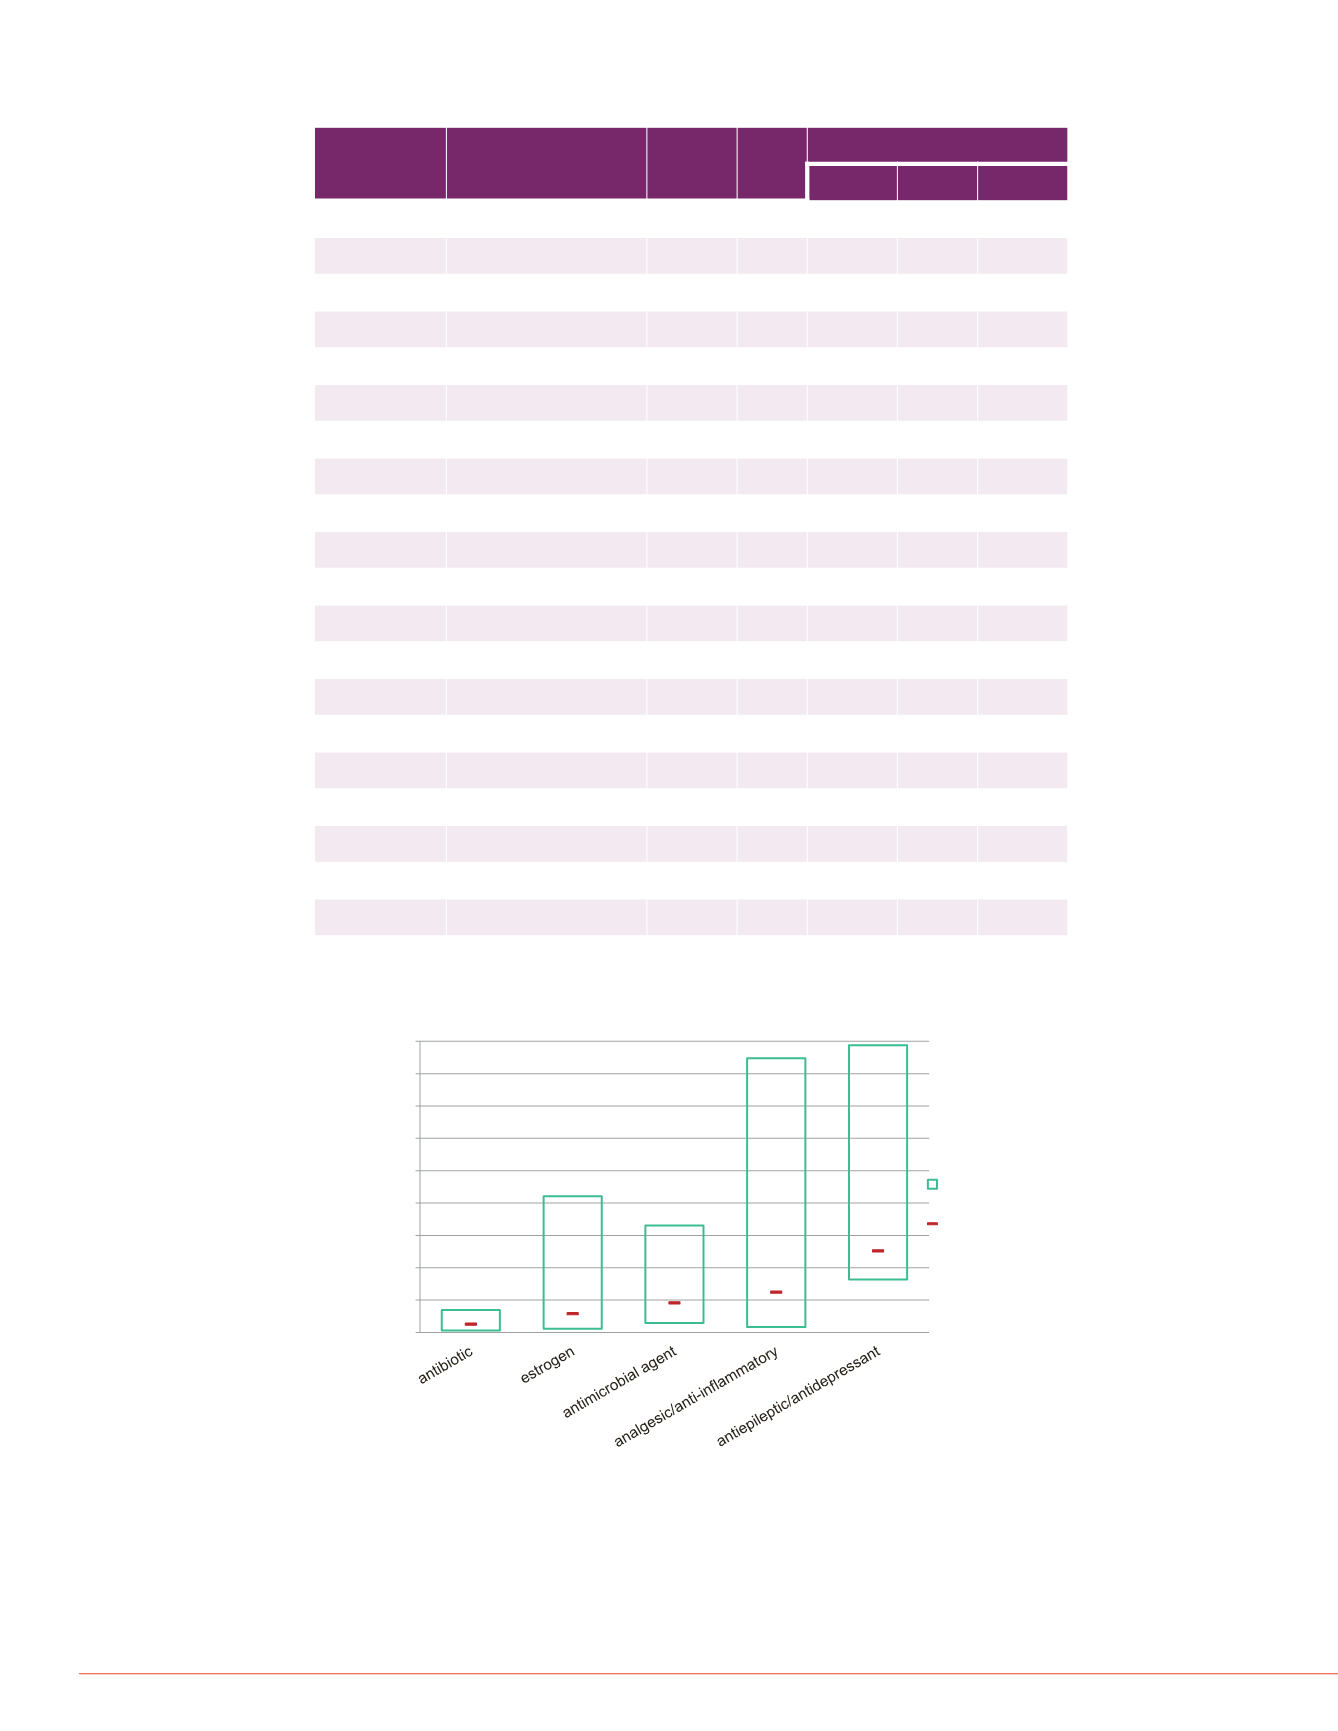
FIGURE 1. Median concentrations for selected groups of PPCPs
FIGURE 2. Overall effect
Semi-Quantitative Deter
In this presentation, TCS (
used for the demonstrati
processes. They are repre
groups of medicines. The
were first investigated usi
scores for samples treate
similar; while scores for s
(blue) were quite different
effect on samples than sea
rate: 450 mL/min
COOH in 10:90/CH
3
OH:H
2
O
.95
±
0.3
:90/CH
3
CN:H2O, pH 6.95
±
0.3
% B
Curve
5
5
75
5
95
7
95
5
5
5
Despite the vast number of
compounds (i.e., dichloroh
methyl Triclosan (Me-TCS),
quantitative concentrations
and Me-TCS are shown in
while other compounds rea
Compound
Name
Usage
CAS #
Occur.
Concentration (ng/L)
Min
Max
Median
Caffeine
Stimulant
58-08-2
100%
2.95E+02 2.52E+04 5.45E+03
Carbamazepine
Antiepileptic/antidepressant 298-46-4
100%
6.96E+02 1.12E+04 2.52E+03
DEET
insect repellent
134-62-3
100%
2.19E+02 1.81E+03 6.52E+02
Lidocaine
anesthetic/anti-arrhythmic 137-58-6
100%
1.75E+02 3.41E+03 6.48E+02
Lincomycin
Antibiotic
154-21-2
100%
5.18E+01 9.29E+03 6.36E+02
Ketoprofen
analgesic/anti-inflammatory 22071-15-4 100%
4.56E+01 3.51E+02 1.27E+02
Bezafibrate
lipid regulator
41859-67-0 100%
3.41E+01 3.24E+02 7.16E+01
Sulfamethazine
Antibiotic
57-68-1
97%
1.16E+01 1.14E+02 3.12E+01
Bisphenol A
commercial additive
80-05-7
95%
1.60E+03 2.80E+06 9.42E+03
Acetaminophen
analgesic/anti-inflammatory 103-90-2
95%
3.52E+02 7.86E+05 8.03E+03
Diclofenac
analgesic/anti-inflammatory 15307-86-5 95%
2.70E+00 2.08E+04 1.27E+03
Norfloxacin
antibiotic
70458-96-7 95%
1.91E+02 1.03E+03 4.33E+02
Triclocarban
antimicrobial/antifungal
101-20-2
95%
1.04E+01 1.27E+03 2.97E+02
Triclosan
antibacterial/antifungal
3380-34-5
87%
2.07E+02 1.26E+05 3.30E+03
Estrone
estrogen
53-16-7
85%
5.10E+00 1.64E+03 2.65E+02
Oxolinic acid
antibiotic
14698-29-4 85%
7.89E+01 6.42E+03 1.62E+02
Oxybenzone
sunscreen
131-57-7
82%
1.80E+00 1.43E+04 2.95E+02
Norethindrone
ovulation inhibitor
68-22-4
82%
4.64E+01 1.46E+03 2.75E+02
Ciprofloxacin
antibiotic
85721-33-1 79%
9.34E+02 5.76E+04 4.00E+03
Estriol
estrogen
50-27-1
79%
2.69E+01 2.31E+04 6.57E+02
Ibuprofen
analgesic/anti-inflammatory 15687-27-1 77%
1.49E+01 1.25E+05 4.37E+03
TABLE 2. Quantitative results for PPCPS with > 75% occurrence in the 35
samples analyzed
0
1000
2000
3000
4000
5000
6000
7000
8000
9000
Concentration (ng/L)
25th-75th
Percentile
median
Standards
20
°
Figure 3. Relative concent