


 284 / 302

Experimental
Preparation of Standards
Standards were prepared by infusing saturated vapor of
standard-grade samples of phenol, propylene glycol
monomethyl ether (PGME), methyl-ethyl ketone (MEK),
and ethylacetate, respectively into a flow of ambient air
using a gastight syringe pumping system connected to the
Ion Max
™
source of the mass spectrometer (Figure 2). The
concentrations of standards were calculated as a function
of the infusion rate of saturated vapor of the respective
standards into a non-contaminated, continuous flow of
atmospheric air, drawn under normal conditions of
temperature and pressure. See Tables 2 and 3.
Ps = Vapor pressure of the compound (mm Hg at 21 ºC)
Pa = Atmospheric pressure (mm Hg at 21 ºC)
I = Infusion rate (µL/min)
F = Sampling pump flow (L/min)
W = Molecular weight of analyzed compound
V = Volume (24 liters at 21 ºC)
Sample Analysis
Air samples were drawn directly from open atmosphere
into the Ion Max source housing through the built-in
probe aperture. The set-up consisted of an infusion pump
regenerative blower, with the drain tube of the source
chamber serving as the outlet. Following APCI, the
resulting ions entered the mass spectrometer through the
ion transfer tube interface.
MS Conditions
Mass spectrometer:
Thermo Scientific TSQ Quantum
Discovery MAX
APCI corona voltage: 4 kV (- 4 kV in negative ion mode)
Ion transfer tube
temperature:
180 ºC
Skimmer offset:
5 V
CID gas pressure:
1.5 mTorr
Resolution:
Unit Resolution (0.7 FWHM)
Analytical scan type: Selective reaction monitoring
(SRM)
SRM conditions:
Scan time: 50 ms
Scan width: 1.000 Da
The MS/MS experimental conditions for SRM are
shown in Table 4.
Conc
(
ppb
)
=
Ps
Pa
×
I
F
×
1000
V
W
ppb
Conc
mµg
Conc
×
=
)
(
) / (
3
Syringe capacity
Syringe speed
1
2
3
4
5
6
7
8
9
Flow rate (µL/min)
10 µL
0.1
0.15
0.20
0.35
0.50
0.75
1.0
1.5
2.5
100 µL
1.0
1.5
2.0
3.5
5.0
7.5
10
15
25
1 mL
10
15
20
35
50
75
100
150
250
2.5 mL
25
38
50
88
125
188
250
375
625
5 mL
50
75
100
175
250
375
500
750
1250
10 mL
100
150
200
350
500
750
1000
1500
2500
50 mL
350
560
720
1230
1800
2560
Phenol
Ethylacetate
MEK PGME
Vapor pressure (Ps)
0.62
75.1
75.6
12
Syringe capacity (mL)
5
1
1
1
Speed setting
9
7
2
7
Infusion rate (µL/min)
1250
100
15
100
Sampling pump flow (L/min)
57
57
55
57
Molecular weight
94
88
72
90
Concentration (ppb)
18
173
27
28
Concentration (µg/m
3
)
70
636
81
104
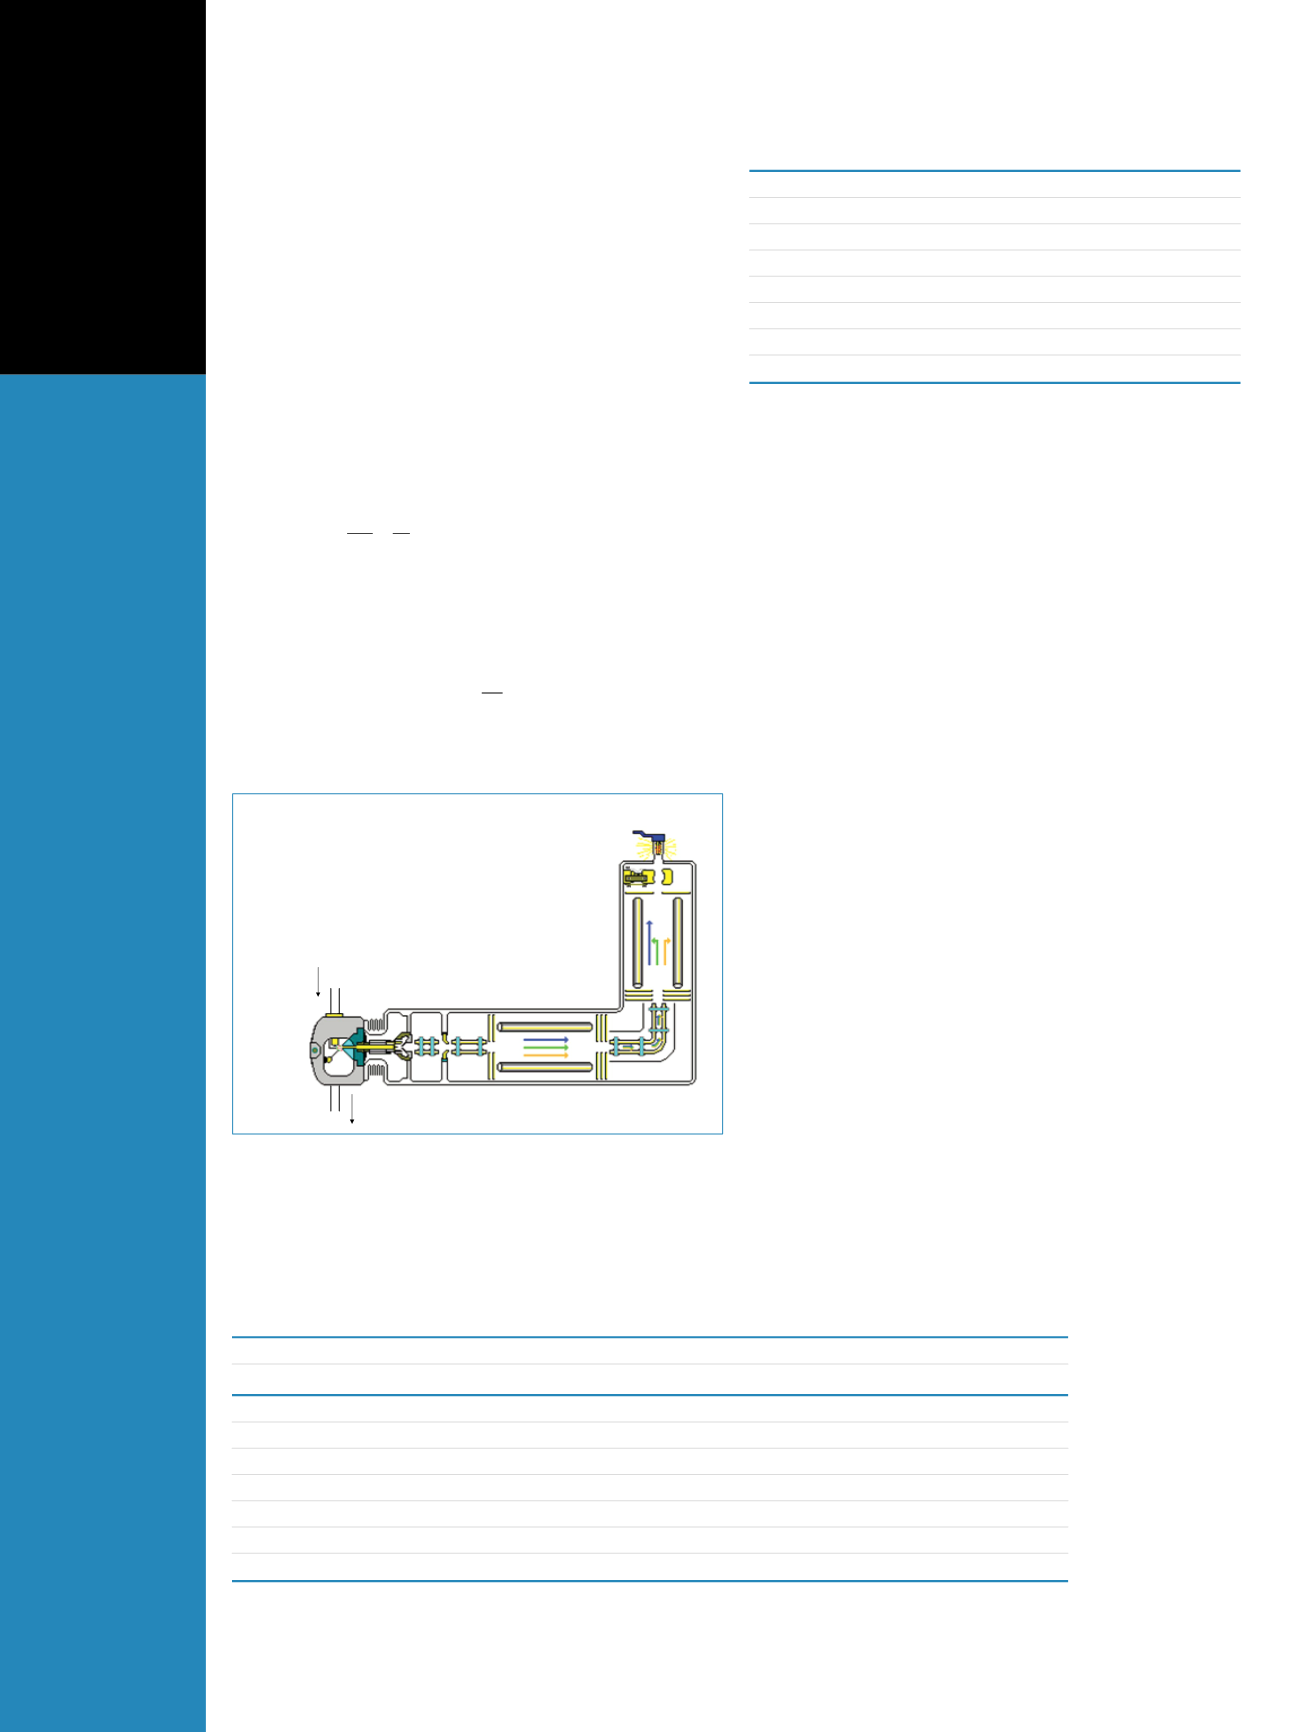
Detector
TSQ Quantum Analyser
Ambient air
inlet
Sampling Pump
Ionization
Source
(APCI)
Figure 2: Block diagram of the TSQ Series triple stage quadrupole mass
spectrometer custom source.
Table 2. Calibration of the infusion pump (Correlation between syringe speed and infusion rate).
Table 3. Sample calculation of concentrations of compounds of interest.