


 281 / 302

Compound Monoisotopic Mass Observed Mass Linearity Range ng/mL Correlation Coefficients LOQ ng/mL LOD ng/mL
HMTD
208.07
209.04
1000-100,000
0.9915
1136
341
EGDN
152.01
61.96
200-100,000
0.9997
79
24
TNB
213.00
213.00
10-100,000
0.9971
8
2
DEGDN
196.12
61.96
200-100,000
0.9991
617
185
HMX
296.05
102.05
225-100,000
0.9990
55
16
1,3-DNB
168.02
168.09
32-100,000
0.9950
16
5
RDX
222.03
102.05
225-100,000
0.9990
89
27
TNT
227.02
227.01
10-100,000
0.9977
8
2
2,6-DNT
182.03
152.07
10-100,000
0.9996
3
1
TATP
222.11
348.08
100-100,000
0.9964
28
8
NG
227.00
61.95
200-100,000
0.9994
265
79
2,4-DNT
182.03
152.07
10-100,000
0.9995
7
2
4-A-2,6-DNT
197.04
197.04
160-100,000
0.9998
91
27
TETRYL
287.01
241.02
10-100,000
0.9924
10
3
TMETN
255.14
61.95
200-100,000
0.9990
110
33
2-A-4,6-DNT
197.04
196.04
160-100,000
0.9965
75
22
PETN
316.01
61.95
200-100,000
0.9994
76
23
Table 1: LOQ and LOD of seventeen standard compounds
Analyses of Explosive Compounds in Soil Matrices
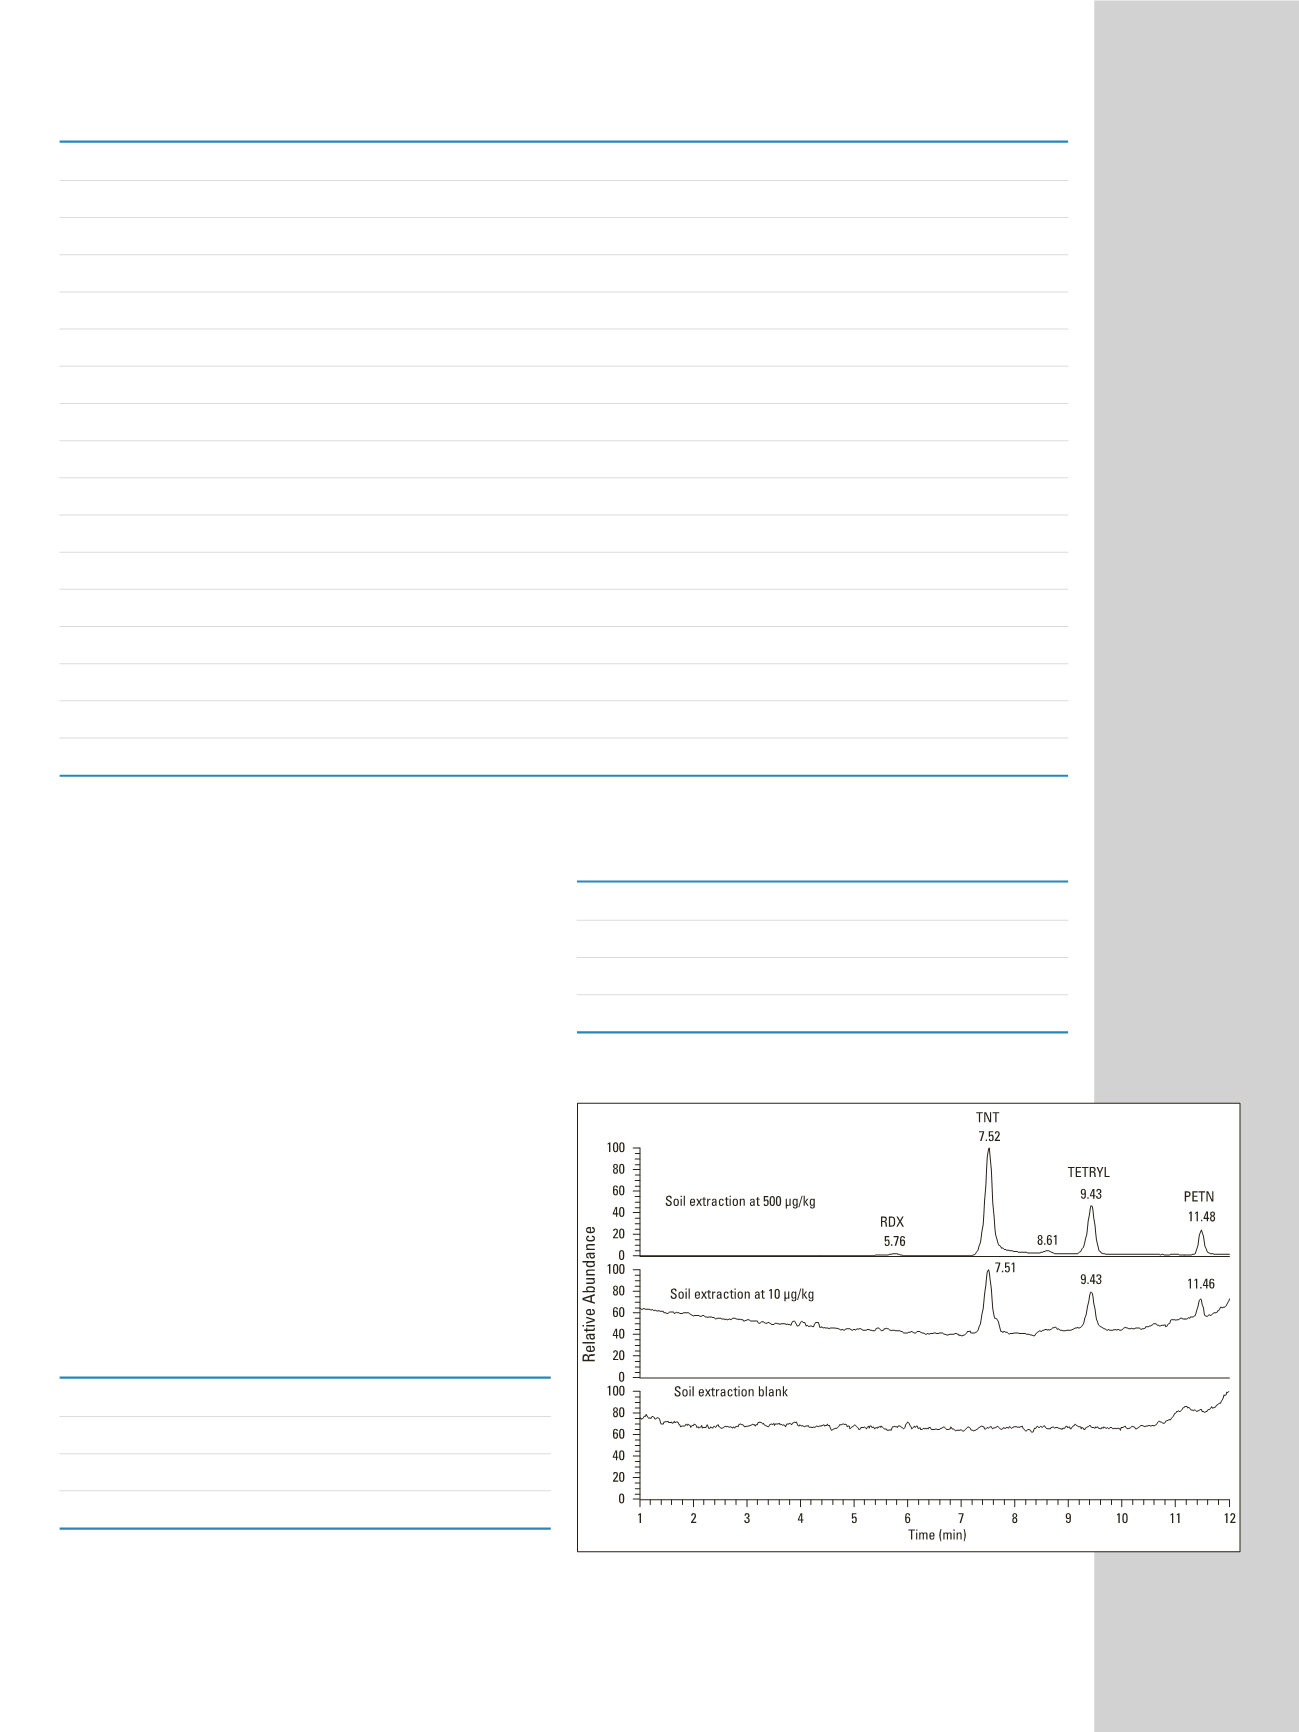
The explosive compounds, extracted from soil sample
with acetonitrile, were analyzed using the UHPLC/MS
method. Figure 4 showed the chromatography traces of
RDX, TNT, Tetryl and PETN at 500 µg/kg, 10 µg/kg and
the solvent extraction blank. The sample extraction
recoveries from the soil matrices were evaluated. Four
compounds, RDX, TNT, Tetryl and PETN, were tested at
500 µg/kg and 10 µg/kg levels (Table 2). Greater than
94% extraction recovery at 500 µg/kg level and more than
82% recovery at 10 µg/kg level were achieved for all the
compounds tested. The method linearity and sensitivity
were investigated for those compounds in soil matrices in
the range of 2 to 500 µg/kg. Linear correlation coefficients
of 0.996 or better were obtained (Figure 5). LOD of 0.2
to 0.6 µg/kg were achieved for TNT, Tetryl and PETN in
soil matrices (Table 3).
Extraction Recovery %
Compound
10 µg/kg
500 µg/kg
RDX
89.7
96.2
TNT
92.1
98.5
Tetryl
90.6
95.4
PETN
82.3
94.3
Table 2: Extraction recoveries in soil matrices
LOQ µg/kg
LOD µg/kg
RDX
16.5
5.0
TNT
0.7
0.2
Tetryl
1.8
0.6
PETN
2.0
0.6
Table 3: The method LOQ and LOD for compounds in soil matrices
Figure 4: The UHPLC/MS analyses of the explosives in soil matrices
Page 7 of 8