


 187 / 302

3
Thermo Scientific Poster Note
•
PN64243-RAFA 0914S
same sequence.
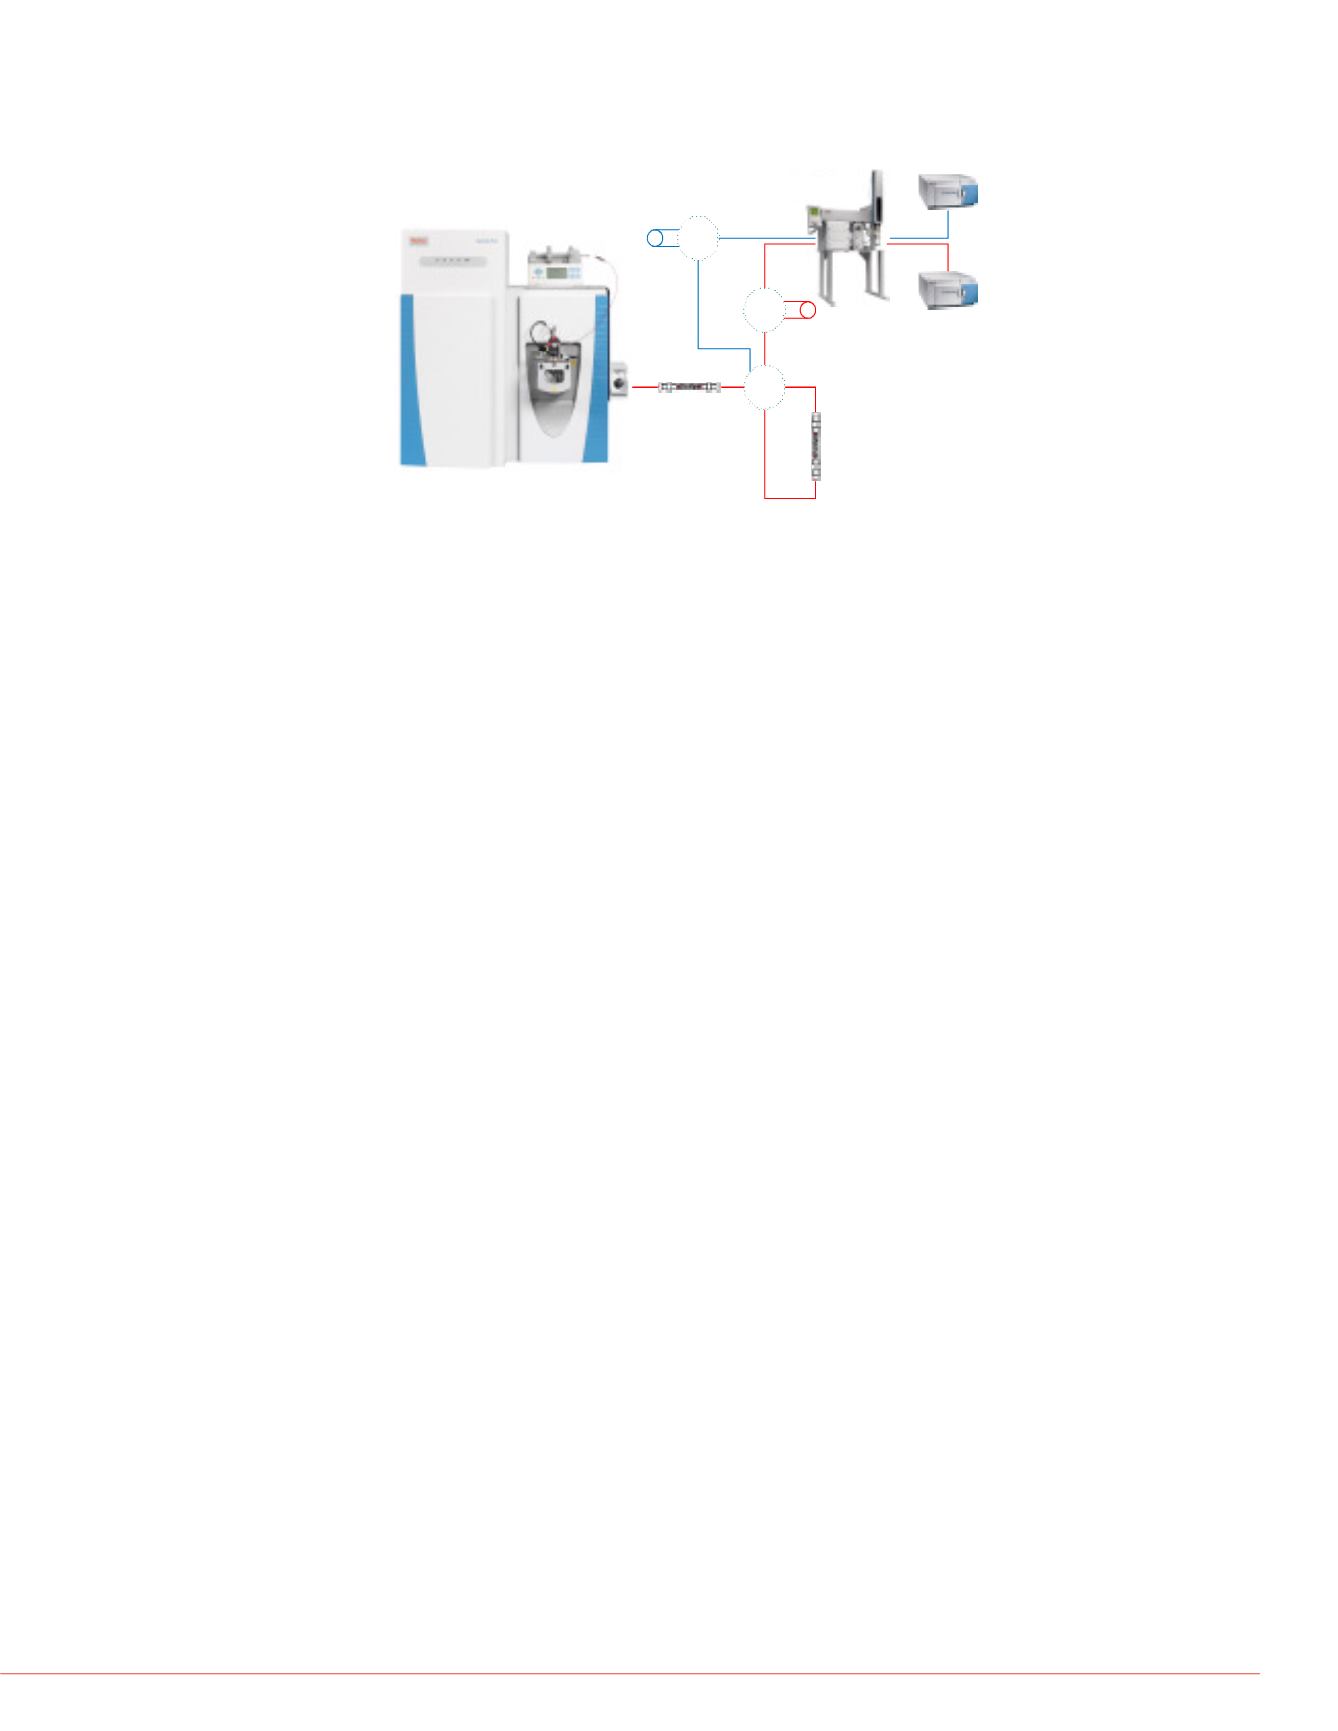
FIGURE 1. Schematics of the EQuan online SPE and
separation system.
6-Port
Valve
6-Port
Valve
Large
Volume
Sample
Loop
Conventional
Volume
Sample Loop
12µmHypersilGold
Preconcentration
Column
3µmAccucore RP-MS
18AnalyticalColumn
Accela1250 pump
Autosampler
Accela600
pump
6-Port
Valve
Liquid Chromatography
For online sample concentration and chromatographic
separation a Thermo Scientific EQuan™ system was
used. A sample volume of 1000 µL was injected onto a
Thermo Scientific Hypersil Gold™ 20
x 2.1 mm trapping
column with subsequent elution onto a Thermo Scientific
Accucore
TM
RP-MS
C
18 analytic column. A 6.7 minute
solvent gradient was applied as shown in Fig 1. This
resulted in a total cycle time of 15 minutes for sample
injection, online concentration and chromatographic
separation.
Mass Spectrometry
For mass spectrometric detection a Thermo Scientific
Exactive Plus mass spectrometer was used and run in full
scan / all ion fragmentation (AIF) mode. In this mode full
scans are permanently alternated with AIF fragmentation
scans. A resolution setting of 70,000 (FWHM@
m/z
200)
was used (see Fig. 2). A mass range of
m/z
103 to 900
was applied (resp.
m/z
70 to 870 and resolution setting
35,000 FWHM for the AIF scans) to be prepared for all
possible contaminants. The mass axis of the system was
calibrated with the standard calibration mix once prior
measurement. Further optimization of the instrument
(compound tuning) was not required.
FIGURE 2. Exactive Plus method setup.
found because they ma
FIGURE 4. Three stage
screen: isotope patter
library search; A: isot
fragment overlay; C: L
Unknown Screening
As a consequence of th
an unknown screening
measured sequence wa
application SIEVE for u
detection. Since all nec
were transferred from Tr
automatically, the comp
started immediately. As
detected. Since such a l
regardless of their signif
clearly needed. As part
referenced against the t
could be applied to rem
signals from the result li
the list. Application of a
this result revealed that
related, while on water
5) seemed to be rather
for significant compone
FIGURE 5. PCA result
differences.
surfacewater4
surfacewater2
ne