


 184 / 302

AN63942_E 05/14S
Africa
+43 1 333 50 34 0
Australia
+61 3 9757 4300
Austria
+43 810 282 206
Belgium
+32 53 73 42 41
Canada
+1 800 530 8447
China
800 810 5118
(free call domestic)
400 650 5118
Denmark
+45 70 23 62 60
Europe-Other
+43 1 333 50 34 0
Finland
+358 9 3291 0200
France
+33 1 60 92 48 00
Germany
+49 6103 408 1014
India
+91 22 6742 9494
Italy
+39 02 950 591
Japan
+81 45 453 9100
Latin America
+1 561 688 8700
Middle East
+43 1 333 50 34 0
Netherlands
+31 76 579 55 55
New Zealand
+64 9 980 6700
Norway
+46 8 556 468 00
Russia/CIS
+43 1 333 50 34 0
Singapore
+65 6289 1190
Spain
+34 914 845 965
Sweden
+46 8 556 468 00
Switzerland
+41 61 716 77 00
UK
+44 1442 233555
USA
+1 800 532 4752
www.thermoscientific.com©2014 Thermo Fisher Scientific Inc. All rights reserved. ISO is a registered trademark of the International Organization for Standardization
(Organisation Internationale De Normalization). All other trademarks are the property of Thermo Fisher Scientific Inc. and its subsidiaries.
This information is presented as an example of the capabilities of Thermo Fisher Scientific products. It is not intended to encourage use of
these products in any manners that might infringe the intellectual property rights of others. Specifications, terms and pricing are subject to
change. Not all products are available in all countries. Please consult your local sales representative for details.
Thermo Fisher Scientific,
San Jose, CA USA is
ISO 9001:2008 Certified.
Application Note 599
Conclusion
A multifaceted approach to identifying and quantifying
non-targeted emerging compounds in environmental
surface and ground water samples impacted by reclaimed
water irrigation has been demonstrated.
• HRAM can be used to identify organic micropollutants
in wastewater-impacted environments, golf course
runoff, and storm water ponds.
• Online SPE coupled with a triple quadrupole MS can
be used to quantitate micropollutants in water samples
down to the sub-ppt (ng/L) level.
• Future work will include studying the toxicological
impact of these compounds on aquatic species.
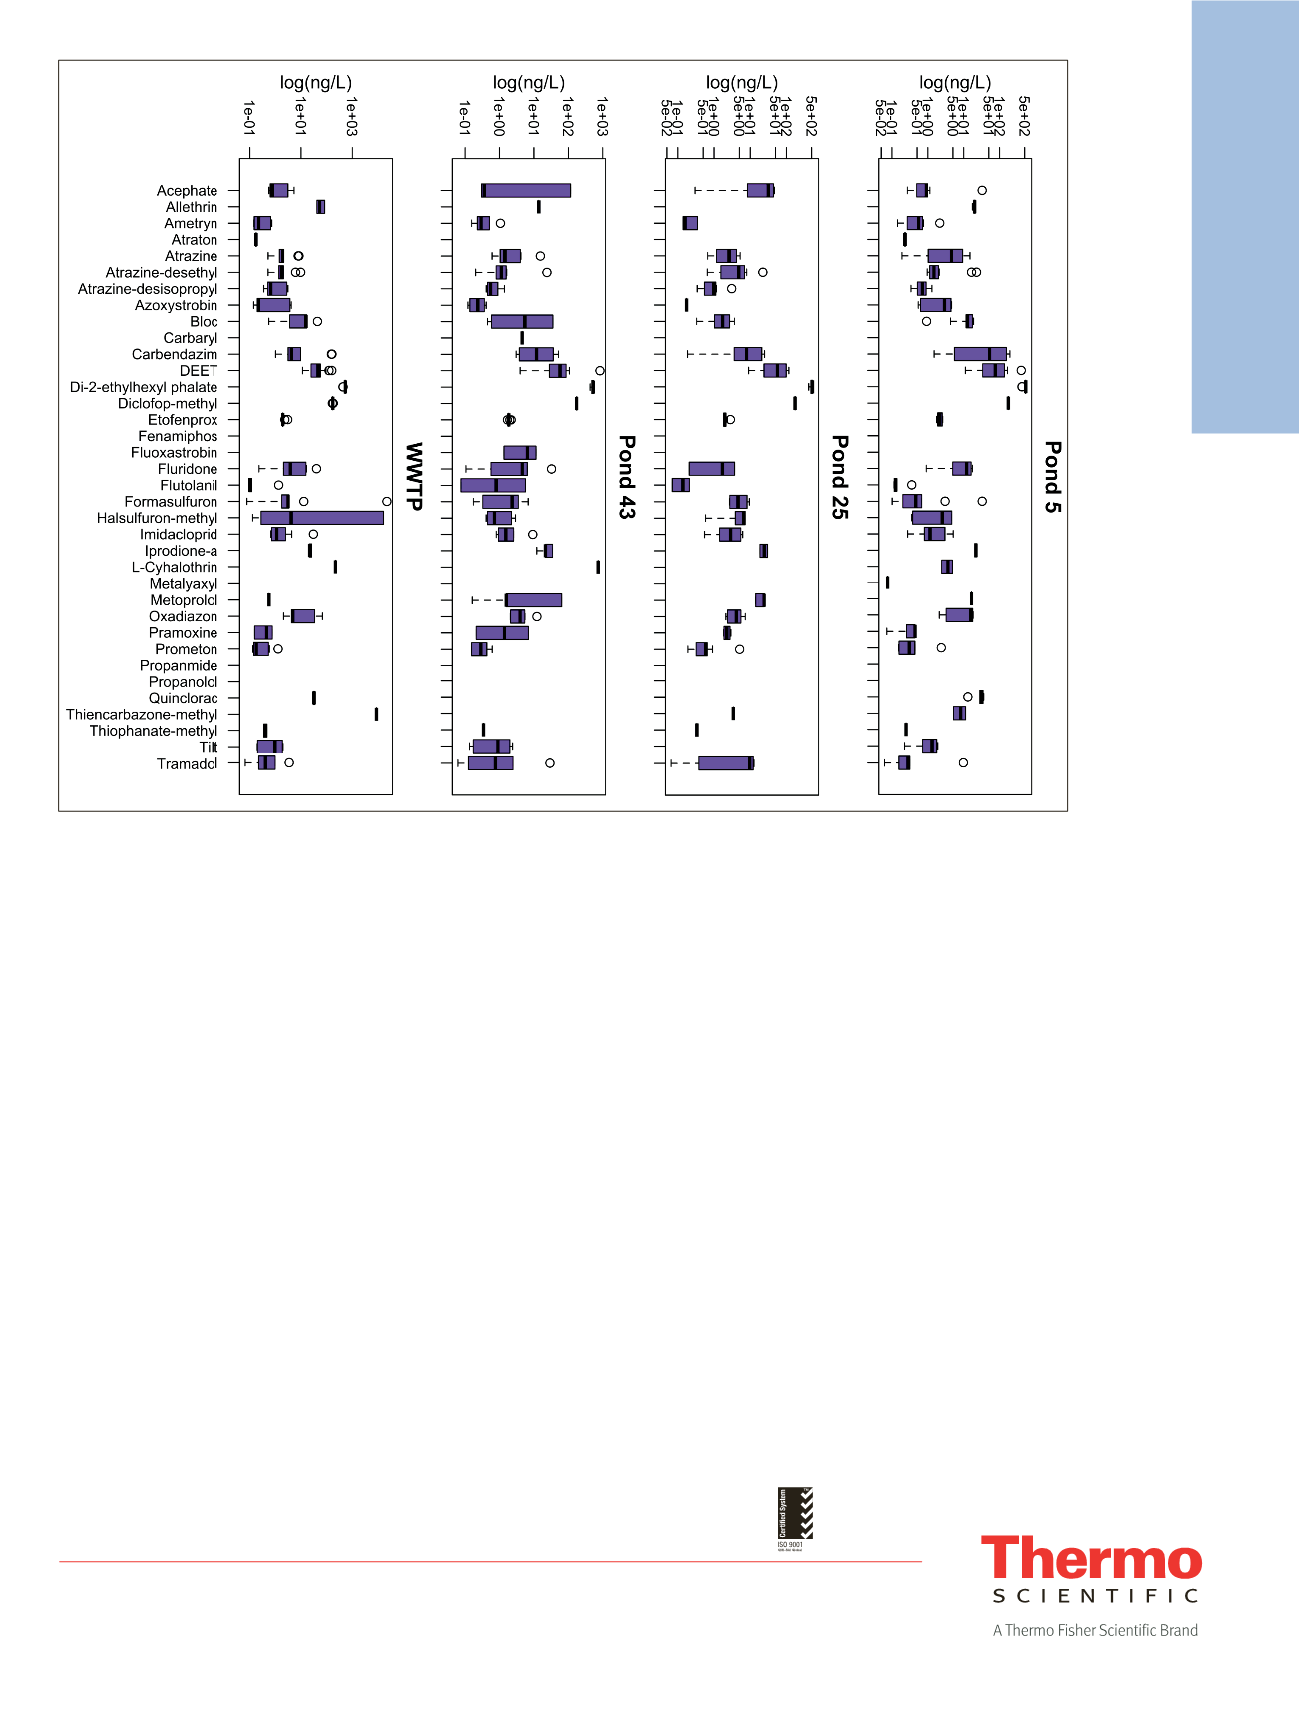
Figure 4. Boxplots depicting the measured contaminant concentrations in wastewater storage and storm water retention ponds on
Kiawah Island. Purple boxes represent the interquartile range and the bar represents the median value. Hashed lines depict the range of
the data and outliers are plotted as open circles.