


 182 / 302

4
A partial list of compounds identified by non-targeted
screening and the samples in which they were found are
listed in Table 2.
Table 2. Compounds identified by non-targeted screening
Compound
Sample(s)
Atraton
Ponds 25, 43
Atrazine
Ponds 5, 25, 43, WWTP, WW
Comp.
Atrazine-2-hydroxy
Pond 25
Carbamazepin
WWTP, WW Comp.
Carbendazim
WWTP
DEET
Ponds 5, 25, 43, WWTP, WW
Comp.
Fluridone
Ponds 25, 43
Hydrocortisone
WWTP, WW. Comp.
Mefluidide
Ponds 5, 25
Metolcarb
WWTP
Metoprolol
WWTP, WW Comp.
Promecarb
WW Comp.
Propanolol
WWTP, WW Comp.
Pyroquilon
Ponds 5, 25, WWTP, WW Comp.
Sulfamethoxazole
WW Comp.
Temeazepam
WW Comp.
Trimethoprim
WWTP, WW Comp.
WWTP = Wastewater treatment plant lagoon
WW Comp = Wastewater composite
Targeted Quantitation by Online SPE LC/MS
Based on the results of the non-targeted screening,
knowledge of chemical usage on the island, and readily
available reference standards, an online SPE LC/MS
method was developed to quantify the occurrence and
distribution of wastewater- and turf-grass-management-
derived organic pollutants on Kiawah Island.
Table 3 provides details of the online SPE LC/MS method,
including the compounds monitored and the instrument
limits of detection (LOD). Samples were quantitated down
to the sub-ppt (ng/L) level.
Figure 4 displays the measured contaminant concentrations
in representative storm and wastewater retention ponds.
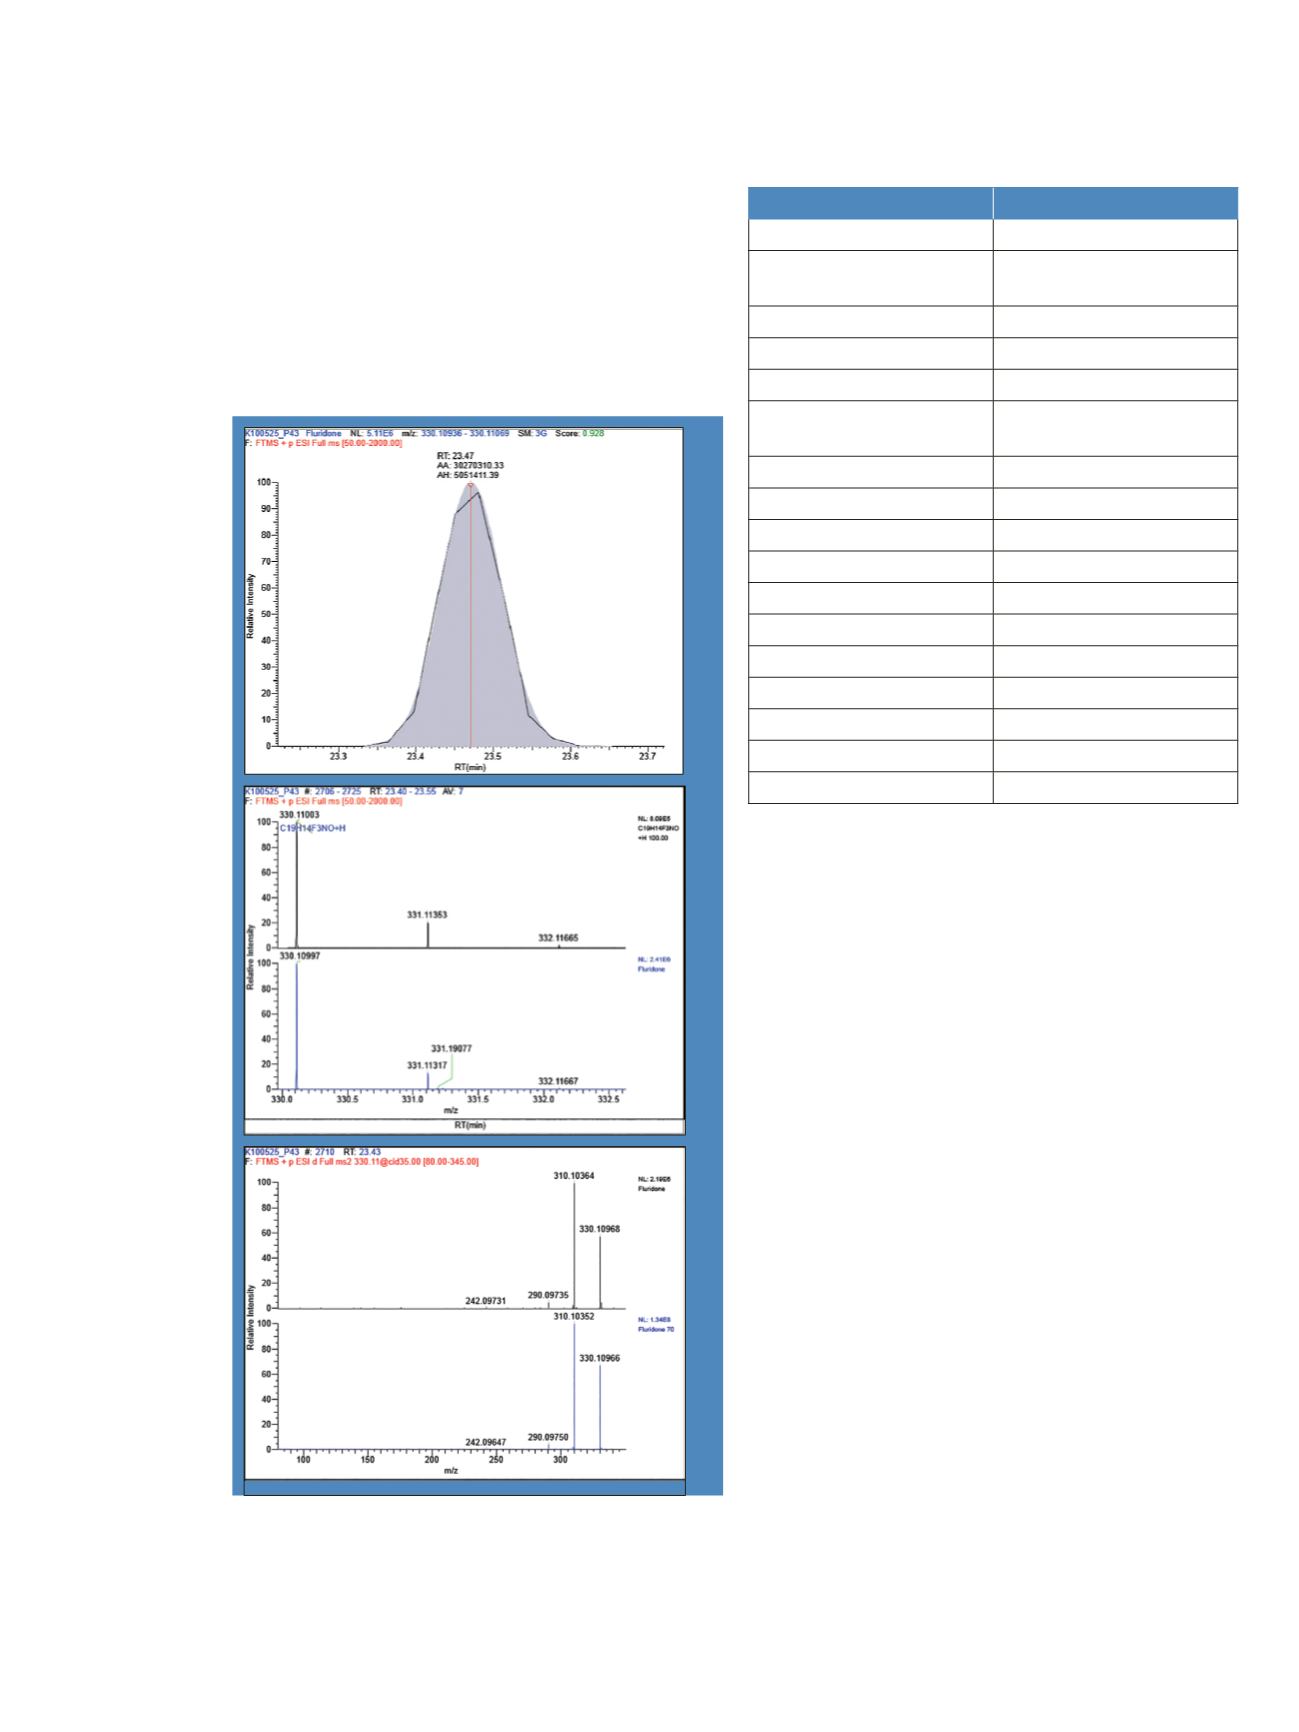
A
B
C
The non-targeted identification of fluridone in Pond 43 by
EFS database screening and spectral library searching in
ExactFinder software is demonstrated in Figure 3. Panel A
shows an EFS database match for fluridone with a
goodness of fit score of 0.93 between a modeled
chromatographic peak and the observed peak. Panel B
compares a modeled mass spectrum for the proposed
pseudomolecular ion [C
19
H
14
F
3
NO+H]
+
and the averaged
full-scan observed data with excellent mass accuracy
(-0.31 ppm) at the mono-isotopic peak and a 100%
isotope pattern score. In Panel C, library searching of the
observed HRAM CID MS
2
spectrum returned a match to
the EFS library entry for fluridone with a score of 70%.
Figure 3. Non-targeted identification of fluridone in Pond 43. A) EFS
database match for fluridone between a modeled chromatographic
peak (gray area) and the observed peak (black trace). B) Comparison
of a modeled mass spectrum for the proposed pseudomolecular ion
[C
19
H
14
F
3
NO]
M+H
(blue) and averaged full-scan observed data (black).
C) Library searching of the observed HRAM CID MS
2
spectrum
(black) returns a match to the EFS library entry for fluridone (blue)
with a score of 70%.