


 189 / 302

5
Thermo Scientific Poster Note
•
PN64243-RAFA 0914S
wn screening workflows
ies of targeted screening
ere we show how one data
throughput quantitative
targeted investigations in a
r from different sources
out any further treatment. In
control sample and one
sample were run in the
e EQuan online SPE and
Port
lve
6-Port
Valve
Conventional
Volume
Sample Loop
12µmHypersilGold
Preconcentration
Column
ore RP-MS
calColumn
Accela1250 pump
Autosampler
Accela600
pump
6-Port
Valve
on and chromatographic
EQuan™ system was
0 µL was injected onto a
ld™ 20x2.1 mm trapping
n onto a Thermo Scientific
c column. A 6.7 minute
s shown in Fig 1. This
f 15 minutes for sample
and chromatographic
tion a Thermo Scientific
eter was used and run in full
IF) mode. In this mode full
ted with AIF fragmentation
0,000 (FWHM@
m/z
200)
range of
m/z
103 to 900
70 and resolution setting
ns) to be prepared for all
ass axis of the system was
As to be expected, it was possible to identify a good
number of contaminants, yielding a match on all three
confirming points. On the other it was clear that this way of
screening did not cover all possible compounds, as was
visible from the neat standard (as used normally for target
screening on these samples) measured in the same
batch. A clear benefit could be seen in the fact that
fragment information and library spectra were present for
additional confirmation (see Fig. 4).
In addition, a larger database with 2900 components was
applied still left open the question of contaminants not
found because they may not be members of this list
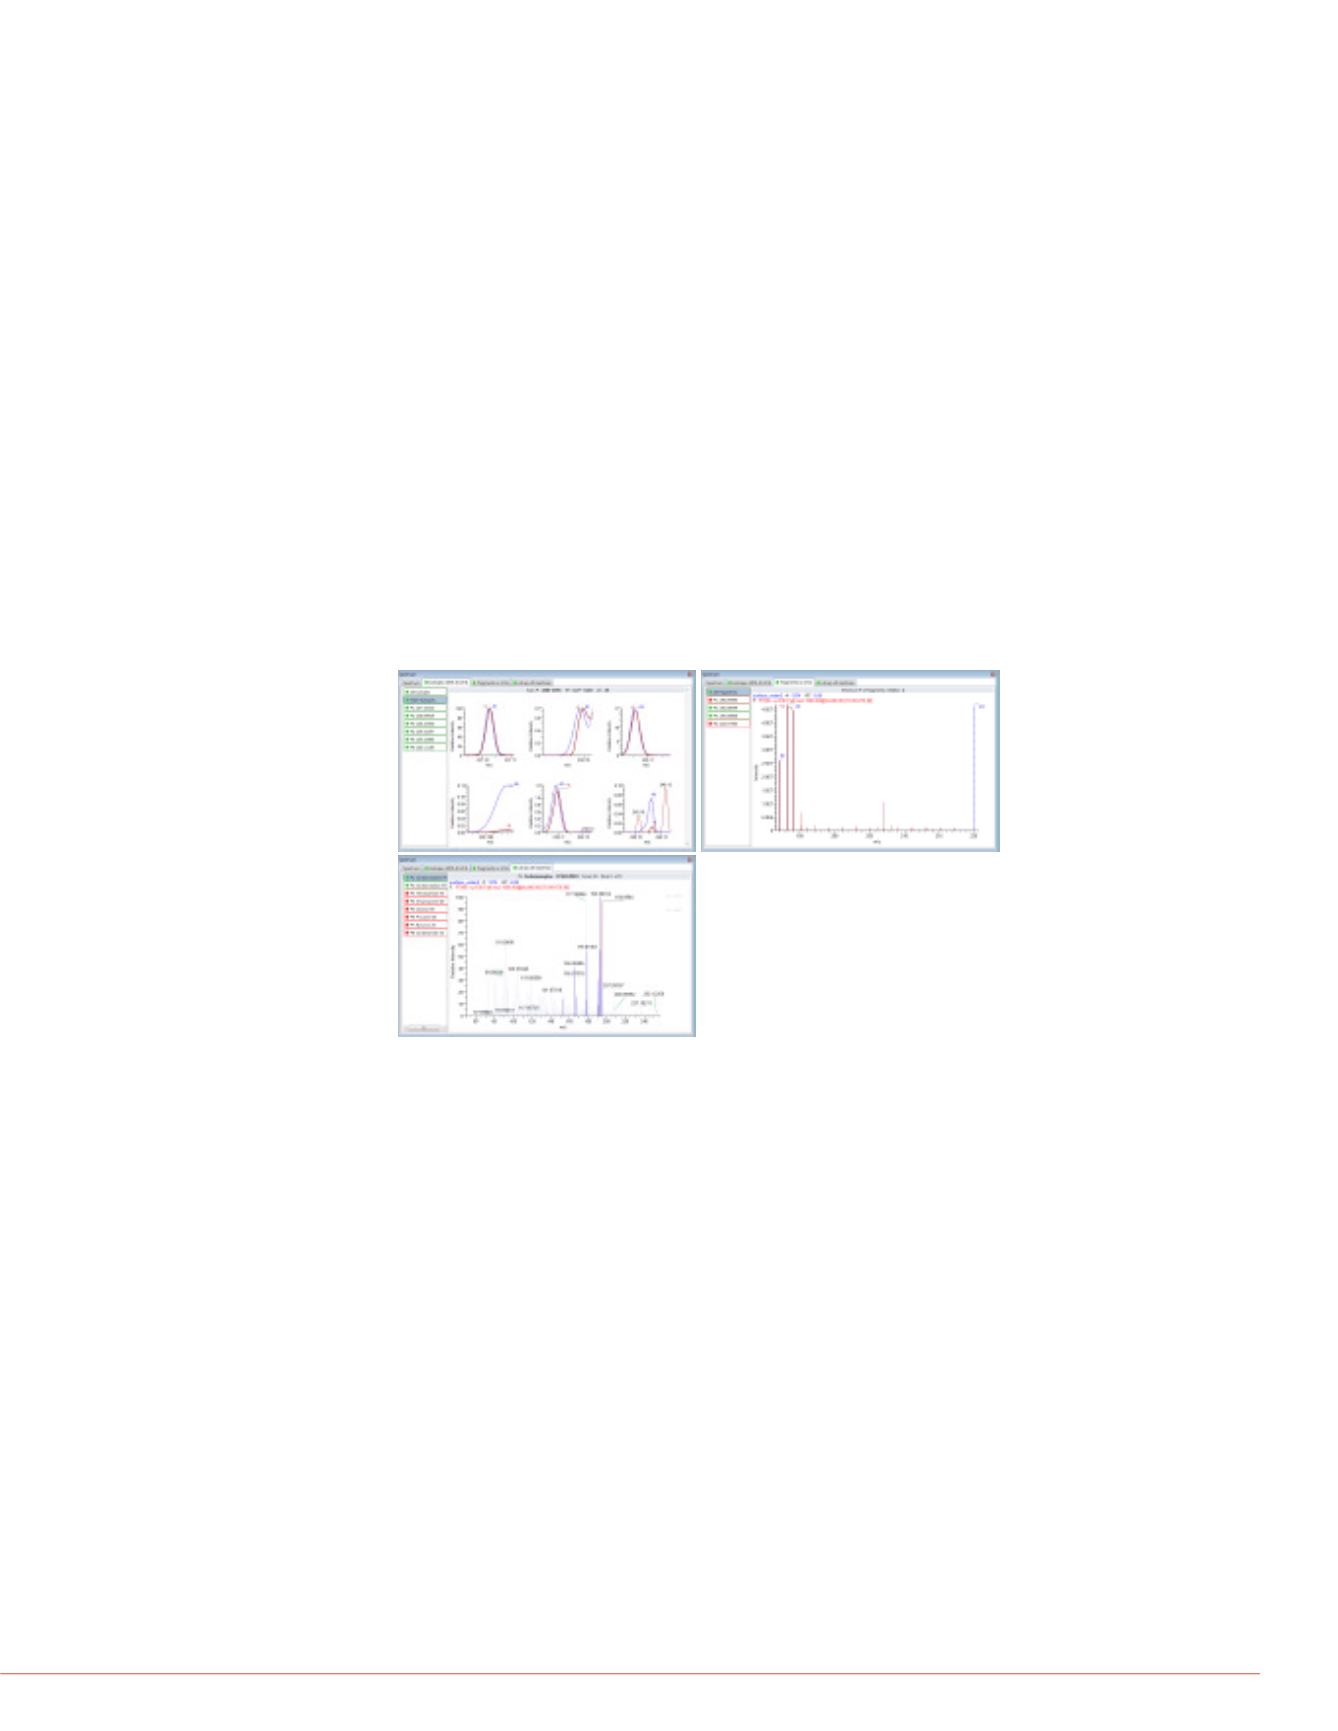
FIGURE 4. Three stages of confirmation in suspect
screen: isotope pattern match, fragment search and
library search; A: isotopic pattern overlay; B:
fragment overlay; C: Library comparison.
A
C
B
Unknown Screening
As a consequence of the limitations of a suspect screen
an unknown screening workflow was run. For this the
measured sequence was transferred to the screening
application SIEVE for unconditioned component
detection. Since all necessary settings and parameters
were transferred from TraceFinder to SIEVE
automatically, the component detection process could be
started immediately. As a result, 5000 components were
detected. Since such a list contains all components
regardless of their significance, refinement of this list was
clearly needed. As part of the process, all samples were
referenced against the tap water sample, so a simple filter
could be applied to remove matrix and background
signals from the result list, leaving 1829 components in
the list. Application of a principal component analysis to
this result revealed that three water samples were closely
related, while on water sample (surface water 1, see Fig.
5) seemed to be rather different in its content, so the filter
For confirmation and re
compound database wa
screening. The advanta
TraceFinder was to be a
suspect and unknown s
be able to use the same
It became visible that so
with higher amounts of
extract significant signal
maintaining full mass ac
intensity. Fig. 7 shows a
Loxoprofen, where the s
roughly the same intensi
signal of the compound.
resolved from the backg
compound can easily be
this clear separation of
high resolving power of
analysis.
FIGURE 7. Importance
unambiguous identific
monoisotopic signl (A)
are surrounded by ma
which are only separat
resolving power used.
Since all final processin
results of target, suspec
easily be combined into
and archiving one singl
between the two applica
shows a short selection
part of the initial target s
unknown screening pro
FIGURE 8. Selection o
present in previous ta
Compound Name Formula
m/z (Ap
Bisoprolol
C18H31NO4
326.23
Candesartan C24H20N6O3 441.16
Carbofuran
C12H15NO3
222.11
Dibenzylamine C14H15N
198.12
Irbesartan
C25H28N6O 429.24
Loxoprofen
C15H18O3
247.13
Mexacarbate C12H18N2O2 223.14
Oxazepam C15H11ClN2O2 287.05
Propiconazole C15H17Cl2N3O2 342.07
Tramadol
C16H25NO2
264.19
Conclusion