


 191 / 302

7
Thermo Scientific Poster Note
•
PN64243-RAFA 0914S
ning is the suspect screen,
ts possibly present in a
tep of condition free
ks already without analytical
for confirmation by providing
and more. In this case, a
000 components was used,
omposition and fragment
tching spectral library
M MS
2
spectra is available
sult, isotopic pattern match,
ary search were used for
).
g result view.
sible to identify a good
ing a match on all three
r it was clear that this way of
ssible compounds, as was
(as used normally for target
measured in the same
seen in the fact that
ry spectra were present for
ig. 4).
with 2900 components was
tion of contaminants not
be members of this list
onfirmation in suspect
ch, fragment search and
attern overlay; B:
comparison.
B
This time the filter was set to look only for significant
changes in the samples surface water 1 and surface water
2. This reduced the list of components to 1671 which were
sent to ChemSpider for identification. This search returned
1529 identifications. Closing of the SIEVE application
automatically transferred this result list back to
TraceFinder, where it was imported as a new compound
database (see Fig. 6).
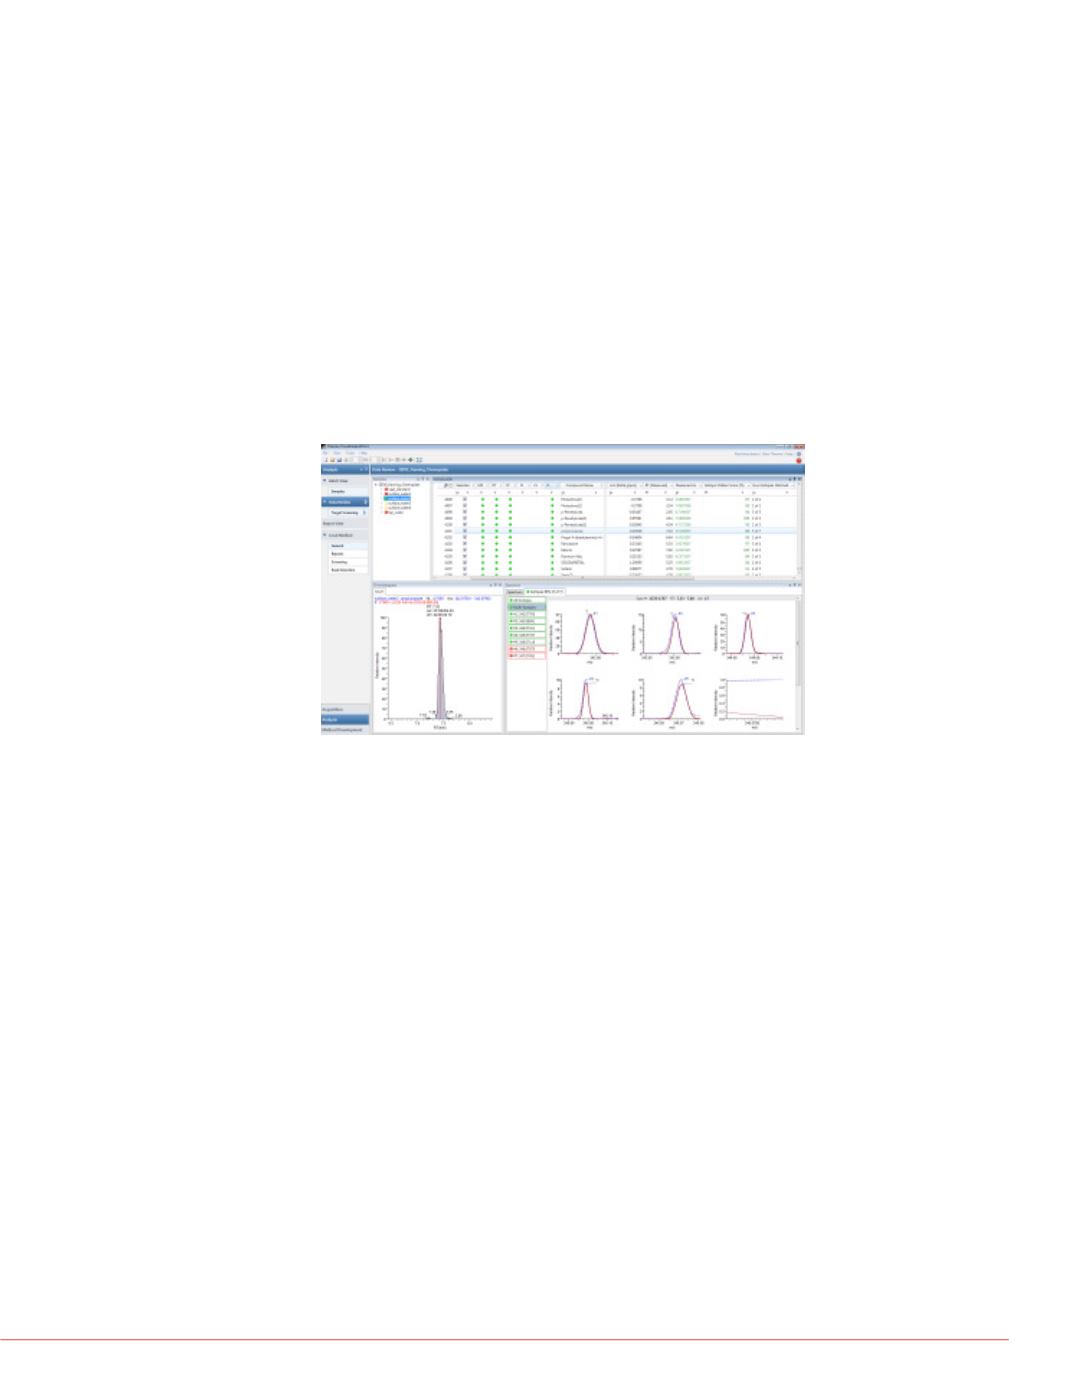
FIGURE 6. Confirmation of the unknown screening
results from SIEVE, propiconazole taken as an
example: The extracted ion chromatogram at the
determined retention time gives a clear signal free
from interferences, the isotope pattern match shows
close to perfect overlay.
For confirmation and reporting of the results this
compound database was used for a normal suspect
screening. The advantage of looping back the results in
TraceFinder was to be able to handle all data – target,
suspect and unknown screen – in one application and to
be able to use the same data review and report templates.
It became visible that some components were coeluting
with higher amounts of matrix, but it was still possible to
extract significant signals from the surrounding matrix,
maintaining full mass accuracy despite the low signal
intensity. Fig. 7 shows anexample of the component
Loxoprofen, where the surrounding matrix signals have
roughly the same intensity as the first and second isotope
signal of the compound. Still the analyte signals are clearly
resolved from the background and matrix signals, so the
compound can easily be detected and confirmed. Key to
this clear separation of analyte and matrix signals is the
high resolving power of R = 70,000 @
m/z
200 used in this
analysis.
FIGURE 7. Importance of sufficient resolution for
unambiguous identification of components: The
monoisotopic signl (A) and the first isotope signal (B)
are surrounded by matrix signals of similar intensity