


 162 / 302

6
0.8 hours for instrumental analysis with the application of
UHPLC, and the same amount of time for data analysis
and quantitation, for a total of 2 hours. This is an 80%
time savings. Other benefits of using this rapid
pretreatment method include enhanced productivity when
there is a large amount of sample, reduced use of organic
solvents, reduced labor for the pretreatment process, and
omission of a nitrogen concentration apparatus.
Calibration Curve Assessment
To review the linearity, the calibration curve of the
standard toxin mixture of microcystin -LR, -RR, and -YR
and nodularin was measured repeatedly within the range
100 to 1,000 pg/mL. As shown in Figure 5, the correlation
coefficient for each of the toxins was between 0.9971 and
0.9996. Reproducibility was ±15%. This is an improvement
compared to the quantitation range for algal toxins in the
water quality test samples reported.
13
Also, it was deemed
possible to perform a linearity assessment at lower
concentrations if necessary in the future since the
signal-to-noise ratio (S/N) was sufficient at the minimum
concentration of 0.1 ng/mL. Thus, based on these results,
we determined that the online preconcentration high-
resolution full-scan MS method has the equivalent trace
quantitation capacity as the conventional method of
solid-phase extraction and LC-MS/MS.
A comparison of the absolute amount introduced into the
mass spectrometer comparing online and offline SPE
shows that online SPE has the same concentration-
injection effect as pretreating and concentrating a 200 mL
sample into 2 mL and injecting 5 μL of the preconcentrated
sample. Thus, it is possible to perform a direct injection,
online SPE with small volumes microanalysis without a
separate using a large offline, pretreatment step. Also, this
method uses UPLC-based chromatography and sharp
peaks are obtained, as shown in Figure 4.
A comparison of the absolute amount introduced into the
mass spectrometer using this online method and offline SPE
shows that the online method has the same concentration-
injection effect as pretreating and concentrating a 200 mL
sample into 2 mL using offline SPE and injecting 5 μL of the
preconcentrated sample. Thus, it is possible to perform a
microanalysis without a separate pretreatment. Also, this
method uses UPLC-based chromatography and sharp peaks
are obtained, as shown in Figure 4.
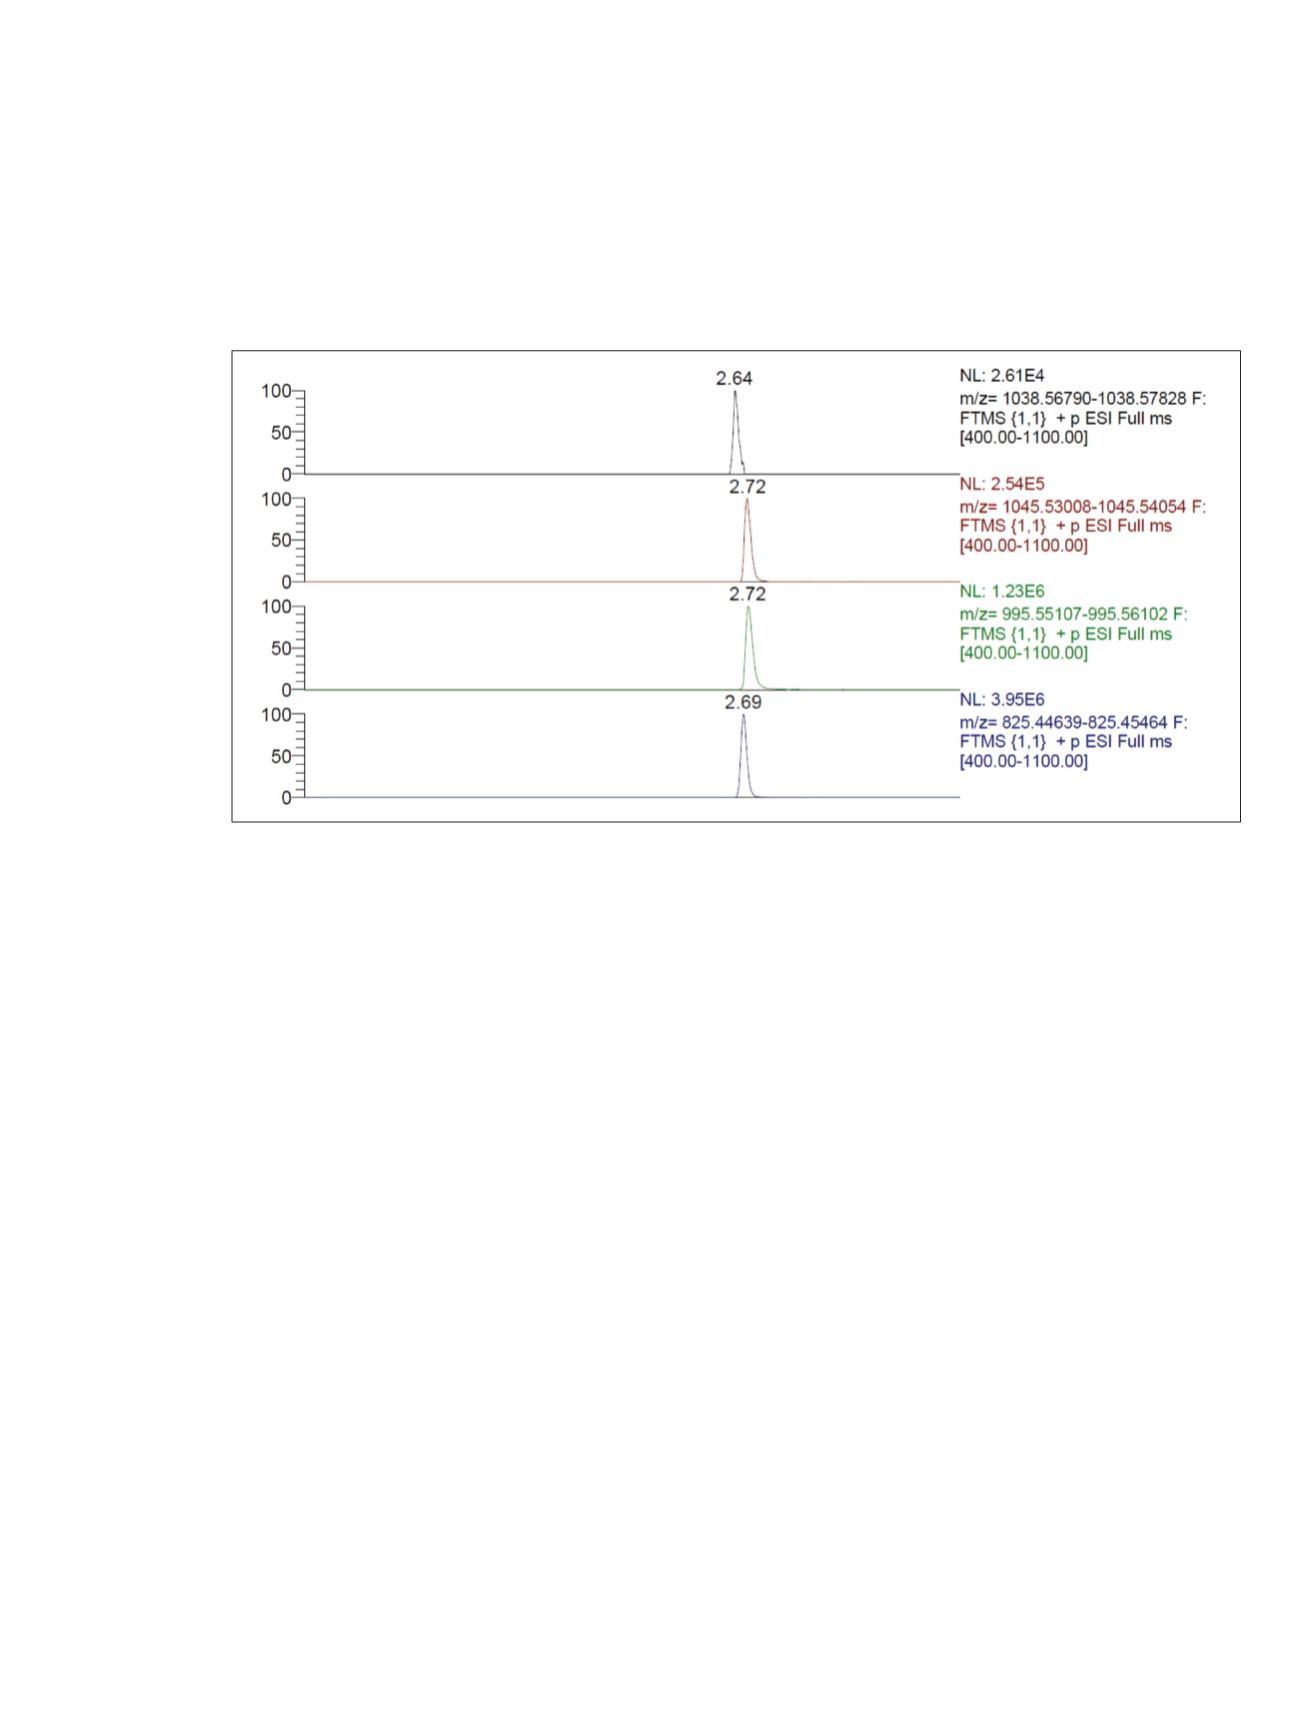
The retention times for microcystin-LR, -RR, and -YR and
nodularin using this method were between 2.6 and 2.8 min.
Due to the application of a relatively short column and a
simple solvent combination, mass separation occurs under
high-resolution conditions at a resolving power of 50,000.
Therefore, even if there is an overlap of retention times,
identification and quantitation based on the difference of
the precise mass unique to each of the toxins is possible as
shown in Table 3. Thus, there was no actual interference
between the toxins (Figure 4).
Compared to the conventional SPE method, which requires
the use of 0.5 to 1 L sample, the online injection method
effectively reduced the analysis time and amount of sample
required. In a typical analysis with five samples, a
conventional SPE method would require 8 hours for the
filtration, solid-phase extraction, and concentration
processes; 2.3 hours for instrumental analysis; and 1 hour
for data analysis and quantitation, for a total of 12.3 hours.
In contrast, the optimized method developed in this study
required 10 minutes for sample division and filtration,
Figure 4. Extracted chromatograms from full-scan data by UHPLC-Orbitrap mass spectrometer
MC-RR
MC-YR
MC-LR
Nodularin