


 161 / 302

5
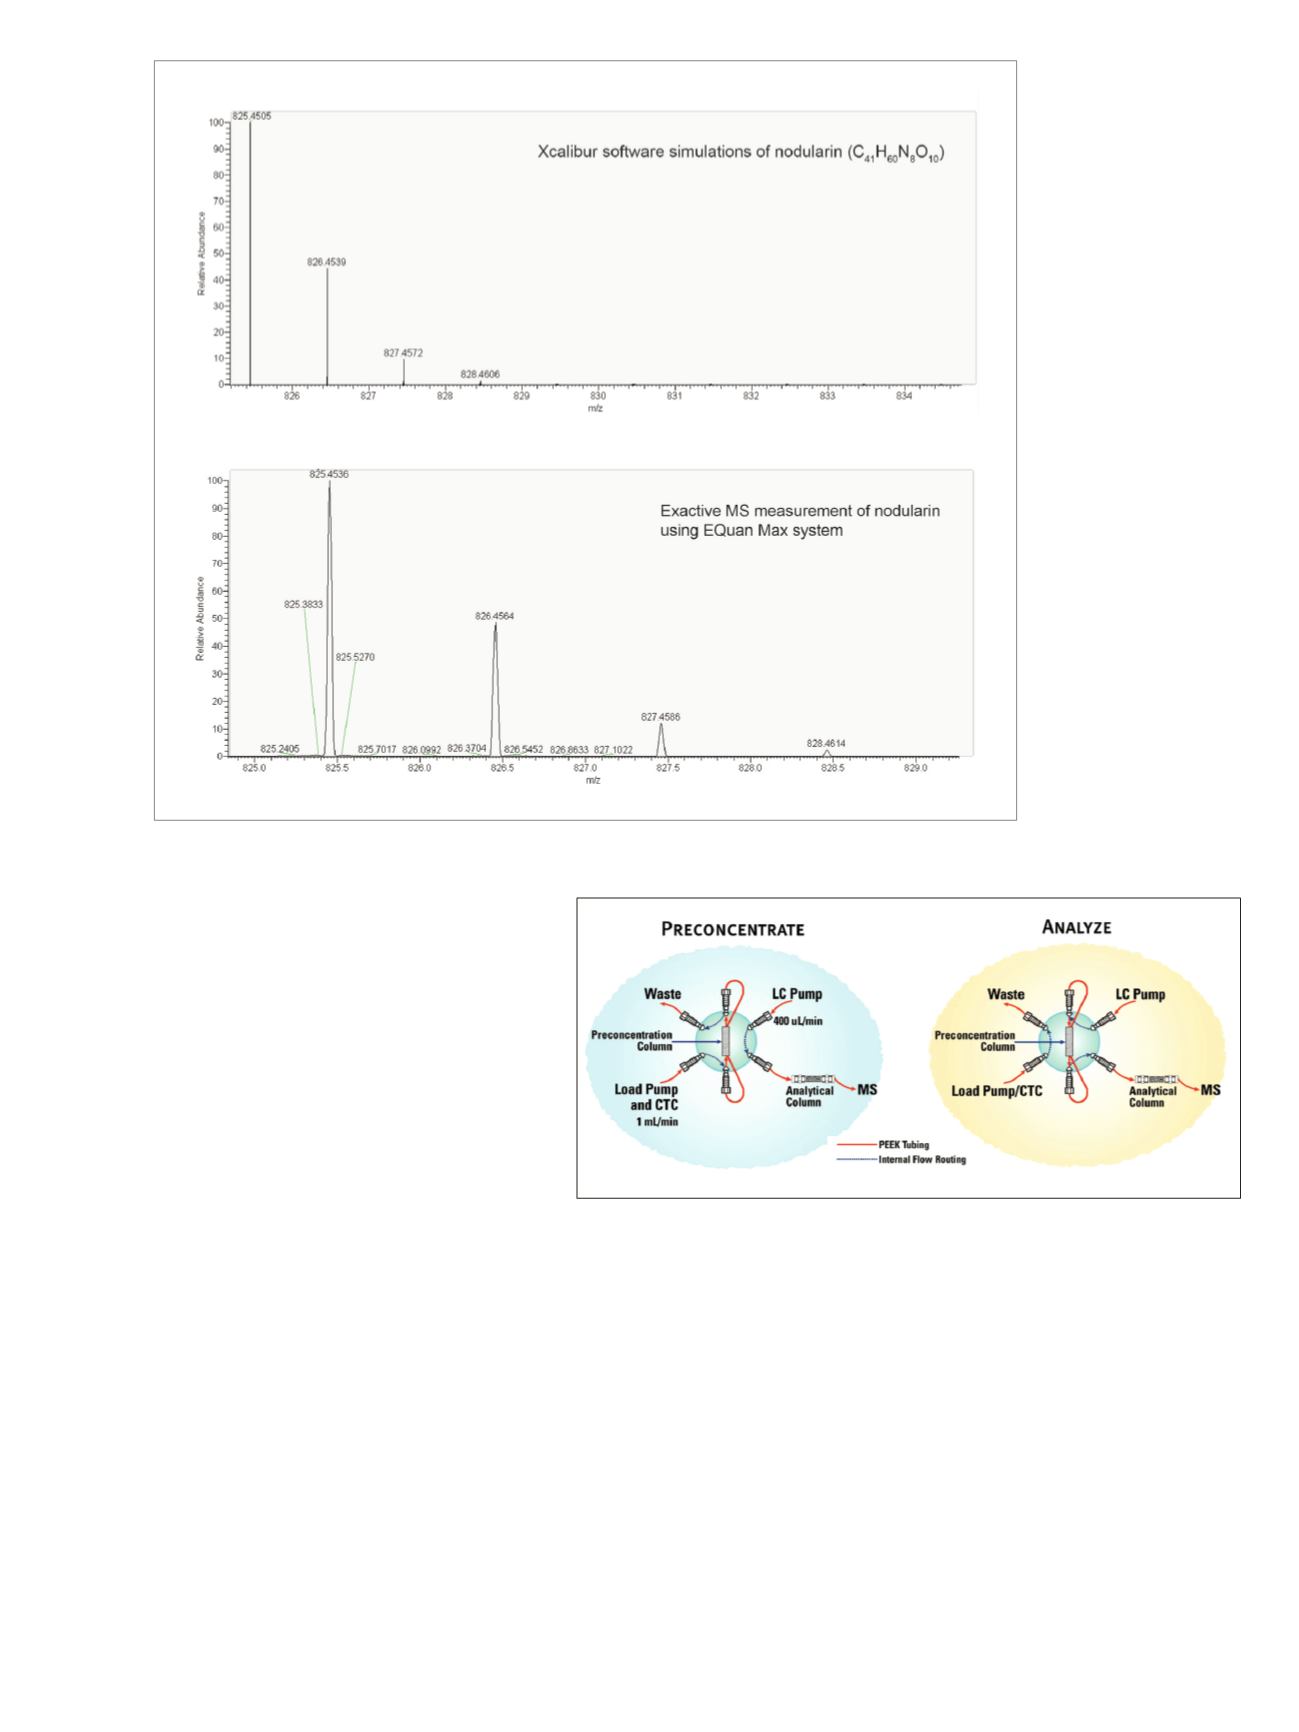
Figure 3. Switching column method for on-line sample injection
From the results of the syringe injection, the quantitation
ions for microcystins -LR, -RR, and YR and nodularin
were set at 995.5543, 519.7898, 1045.5344, and 825.4501,
respectively. In addition, the scanning range for identification
and quantitation of the target compounds was between
m/z
400 and 1100 for simultaneous analysis. However,
the minimum range was set at
m/z
150 to allow
confirmation and quantitation of various algal toxins,
such as anatoxin generated by
Anabaena
, which occurs
just as frequently during an algal bloom.
Optimization of the Online Preconcentration
Method
In this study, 1 mL of each sample was used for the online
preconcentration method. During the five minute analysis,
adsorption and mobilization of the target toxin and
column separation were carried out under the gradient
conditions shown in Table 2. First, an injection of 1 mL of
sample when the 0.1% formic acid and water/acetonitrile
ratio was 98:2 led to the target toxin being adsorbed in
the front part of the trap column and the remainder of the
water sample being diverted to waste. The valve was then
switched to postion 2 for elution from the SPE column
onto the analytical column using 98% acetonitrile. A
summary of the analysis flow, including online SPE, is
shown in Figure 3.
Figure 2. A) Carbon isotope patterns by high-resolution, full-scan MS of microcystins and nodularin, and B) simulated spectrum of nodularin (top) compared to
actual spectrum (bottom), confirming isotope pattern.
B