
5
Thermo Scienti c Poster Note
•
PN ASMS13_W457_DSarracino_E 07/13S
Conclusion
The
in vitro
whole bloo
sample preparation w
method of testing cell
samples.
Spectral Library creati
large number of differe
enrichment strategy.
Pinpoint software allo
modes in complex sa
Future work will be to
list of peptides for sele
Thermo Scientific™ T
instruments. These wi
difficult to quantify in t
pathways that were sh
are also correlated wit
References
1.
Angus DC, Linde-Zwir
(29), 1303-1310
2.
Robbins Basic Patholo
3.
Mendes ME, Baggio-Z
Salomao R. Immunobi
essed proteins and peptides,
e full-scan measurements while
ta to allow sequencing of as many
proteins were identified over 95%
0 ubiquitinylations, peptide
ted into the Pinpoint spectral library.
s for a selected protein/peptide
d in the library can be selected for
wn regulated can be highlighted and
addition to protein class selection,
d pathways specific components,
zed for quantification.
Mascot is a registered trademark of Matr
trademarks are the property of Thermo F
This information is not intended to encou
intellectual property rights of others.
For Research Use Only. Not for use in d
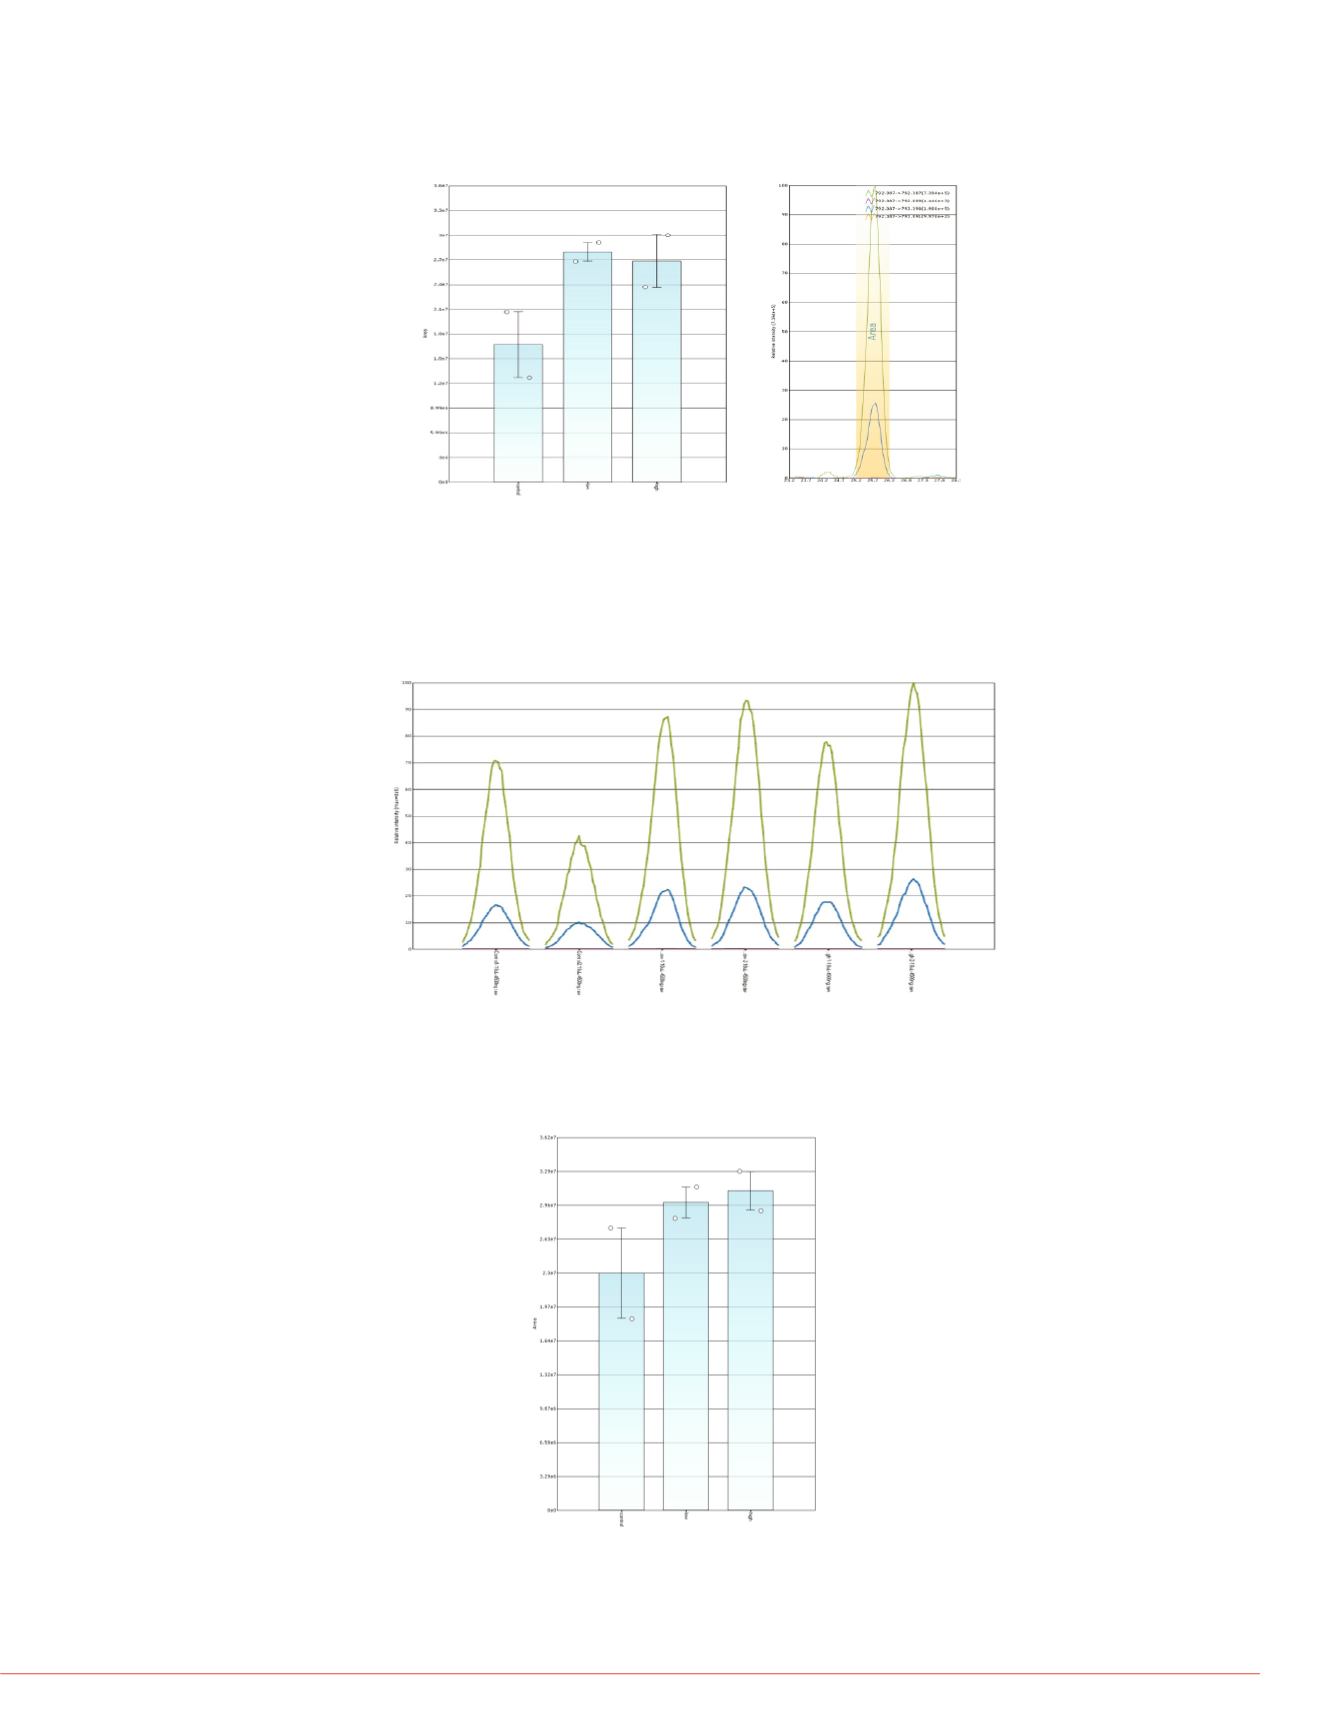
FIGURE 8. Signal Pathway proteins up-regulated from LPS stimulation. Peptide
GGEIEGFR from transforming growth factor beta-1 precursor gi|63025222
[Homo sapiens].
ications. Searches are broken up
ns. This search strategy is
the high-resolution Orbitrap-
iquitination, oxidations and
ases can be searched even by
e integrity of the results.
gies and any fractionation can
h the spectral library function.
FIGURE 7. View of the replicates of sample quantifications from the first two
isotopes (792.387, green: 792.889, blue) of the peptide GDDTPLHLAASHGHR in
Control, Low and High stimulation experiments (pairs, left to right).
FIGURE 9. MyD88 signal pat
Peptide QILEGLK from mito
gi|282847398 [Homo sapiens
FIGURE 6. Quantification of the +2 charge state of peptide
GDDTPLHLAASHGHR from integrin-linked protein kinase gi|4758606 [Homo
sapiens] A) Comparison of Control, Low and High Stimulation B) Alignment of
all isotopes.
A
B


