
4
Detection of Cellular Response to an in vitro Challenge with Bacterial Gram-Negative Lipopolysaccharides (LPS) in Peripheral Blood Mononuclear Cells (PBMCs)
Results
In order to allow the detection of differentially expressed proteins and peptides,
instrumentation should provide enough quantitative full-scan measurements while
simultaneously providing MS/MS fragmentation data to allow sequencing of as many
peptides as possible. In this experiment, ca 4000 proteins were identified over 95%
confidence containing >250 phosphorylations, >150 ubiquitinylations, peptide
oxidations (other than methionine) that were inserted into the Pinpoint spectral library.
Pinpoint software has the advantage in that it allows for a selected protein/peptide
library import. In this example, all kinases identified in the library can be selected for
analysis. Once selected, proteins that are up or down regulated can be highlighted and
verified using Pinpoint software (Figures 6, 7). In addition to protein class selection,
specific proteins of interest (Figure 8) TGF beta and pathways specific components,
(Figure9) MAPKKK 15, can be selected and analyzed for quantification.
isolated according to the
e of 60 min. Rinsed cell pellets
mM Tris-HCl 2.5% n-propanol
2 mL with 50 mM Tris, 5 mM CaCl2
in Protease, MS Grade.
the samples were loaded into 96-well
00. Separations were done on a
n, (5 µm particle, 300Å pore, 150 µm
a 5 µm particle, 200Å pore C18AQ
Thermo Scientific™ Nanospray
Orbitrap Velos Pro™ MS. Stepped
r 205 min. Buffer A is 2% Methanol
r, 10% isopropanol, 80% acetonitrile
ientific™ Optima™ LC-MS grade.
h stim) pooled for library creation
4.6 mm x 25 cm PS-DVB column
ium formate, 58 mM ammonium
in 91% acetonitrile 9% water (v/v),
B (Figure 2).
nt top 25 method has been used .
using a 1e6 target value, with
ith normal scan resolution.
tes are rejected. Chromatography
d with a peak width of 40 s and a
inject time allowed for MS/MS scans
n using a peak width of 60 s.
software, and MS/MS spectra were
The Mascot® search engine. Two
d. The simple search method (Figure
es and phosphopeptides. The more
M search strategy into multiple
r on the same peptide, are searched
ssignments due to the reduced size
mputational time. Pathway
c™ ProteinCenter™ software (not
spectral libraries which can be
ractionated samples provided the
retention times are consistent.
FIGURE 8. Signal Pathway pr
GGEIEGFR from transformin
[Homo sapiens].
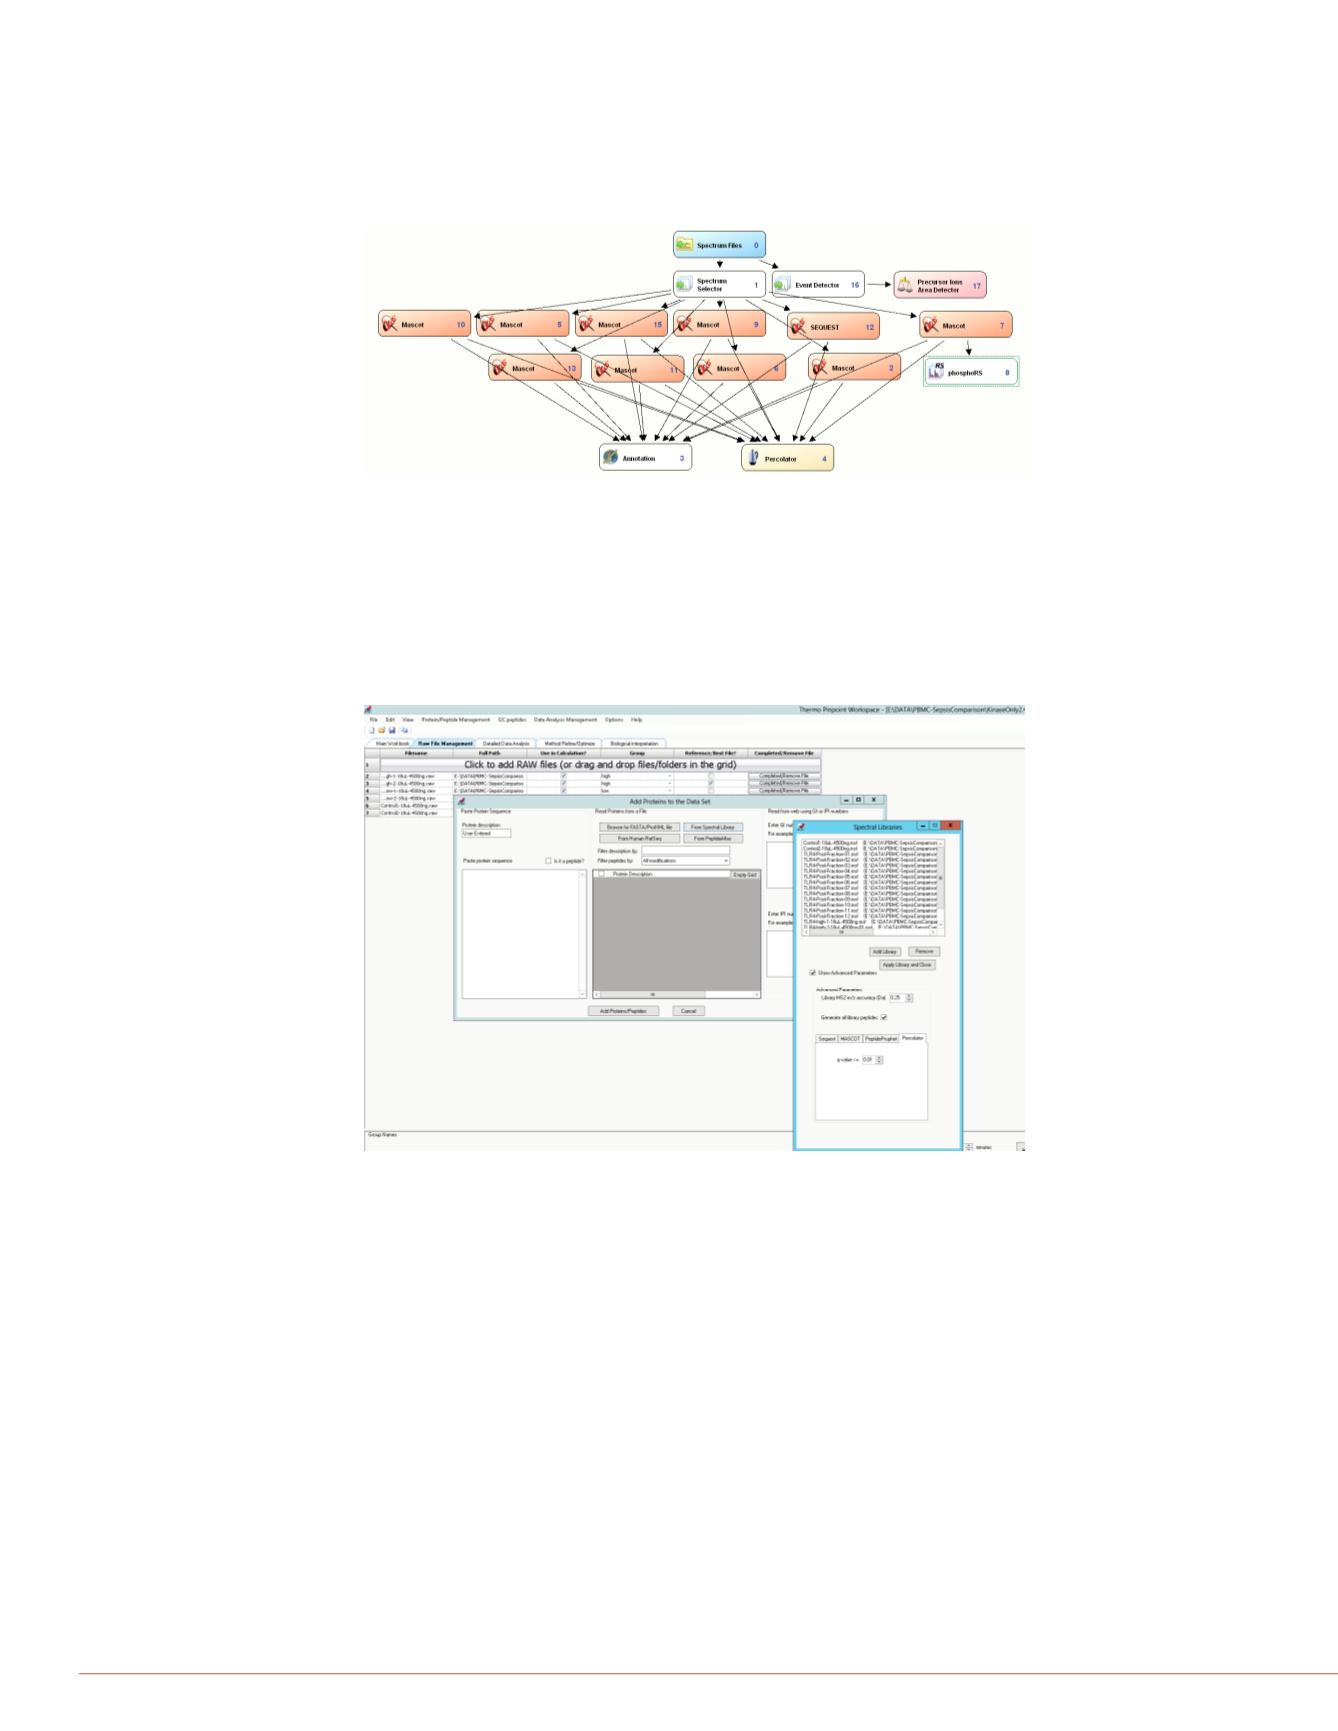
FIGURE 4. Search workflow for multiple modifications. Searches are broken up
into groups of most likely to occur modifications. This search strategy is
computationally intensive and works best with the high-resolution Orbitrap-
analyzed MS2. Many modifications such as ubiquitination, oxidations and
deamidations, semi-tryptic, and different databases can be searched even by
other search engines without compromising the integrity of the results.
FIGURE 5. Results from different search strategies and any fractionation can
then be brought into Pinpoint software through the spectral library function.
FIGURE 7. View of the replica
isotopes (792.387, green: 792
Control, Low and High stimul
FIGURE 6. Quantification of t
GDDTPLHLAASHGHR from i
sapiens] A) Comparison of C
all isotopes.
A


