
5
Thermo Scienti c Poster Note
•
PN ASMS13_W602_BFrewen_E 07/13S
Conclusion
A spectrum library of synthetic
for designing targeted assays,
A library spectrum compr
observed spectrum by id
Library spectra are a con
differences in fragmentat
Some NCE values will pr
When no diagnostic pea
distinguish between isof
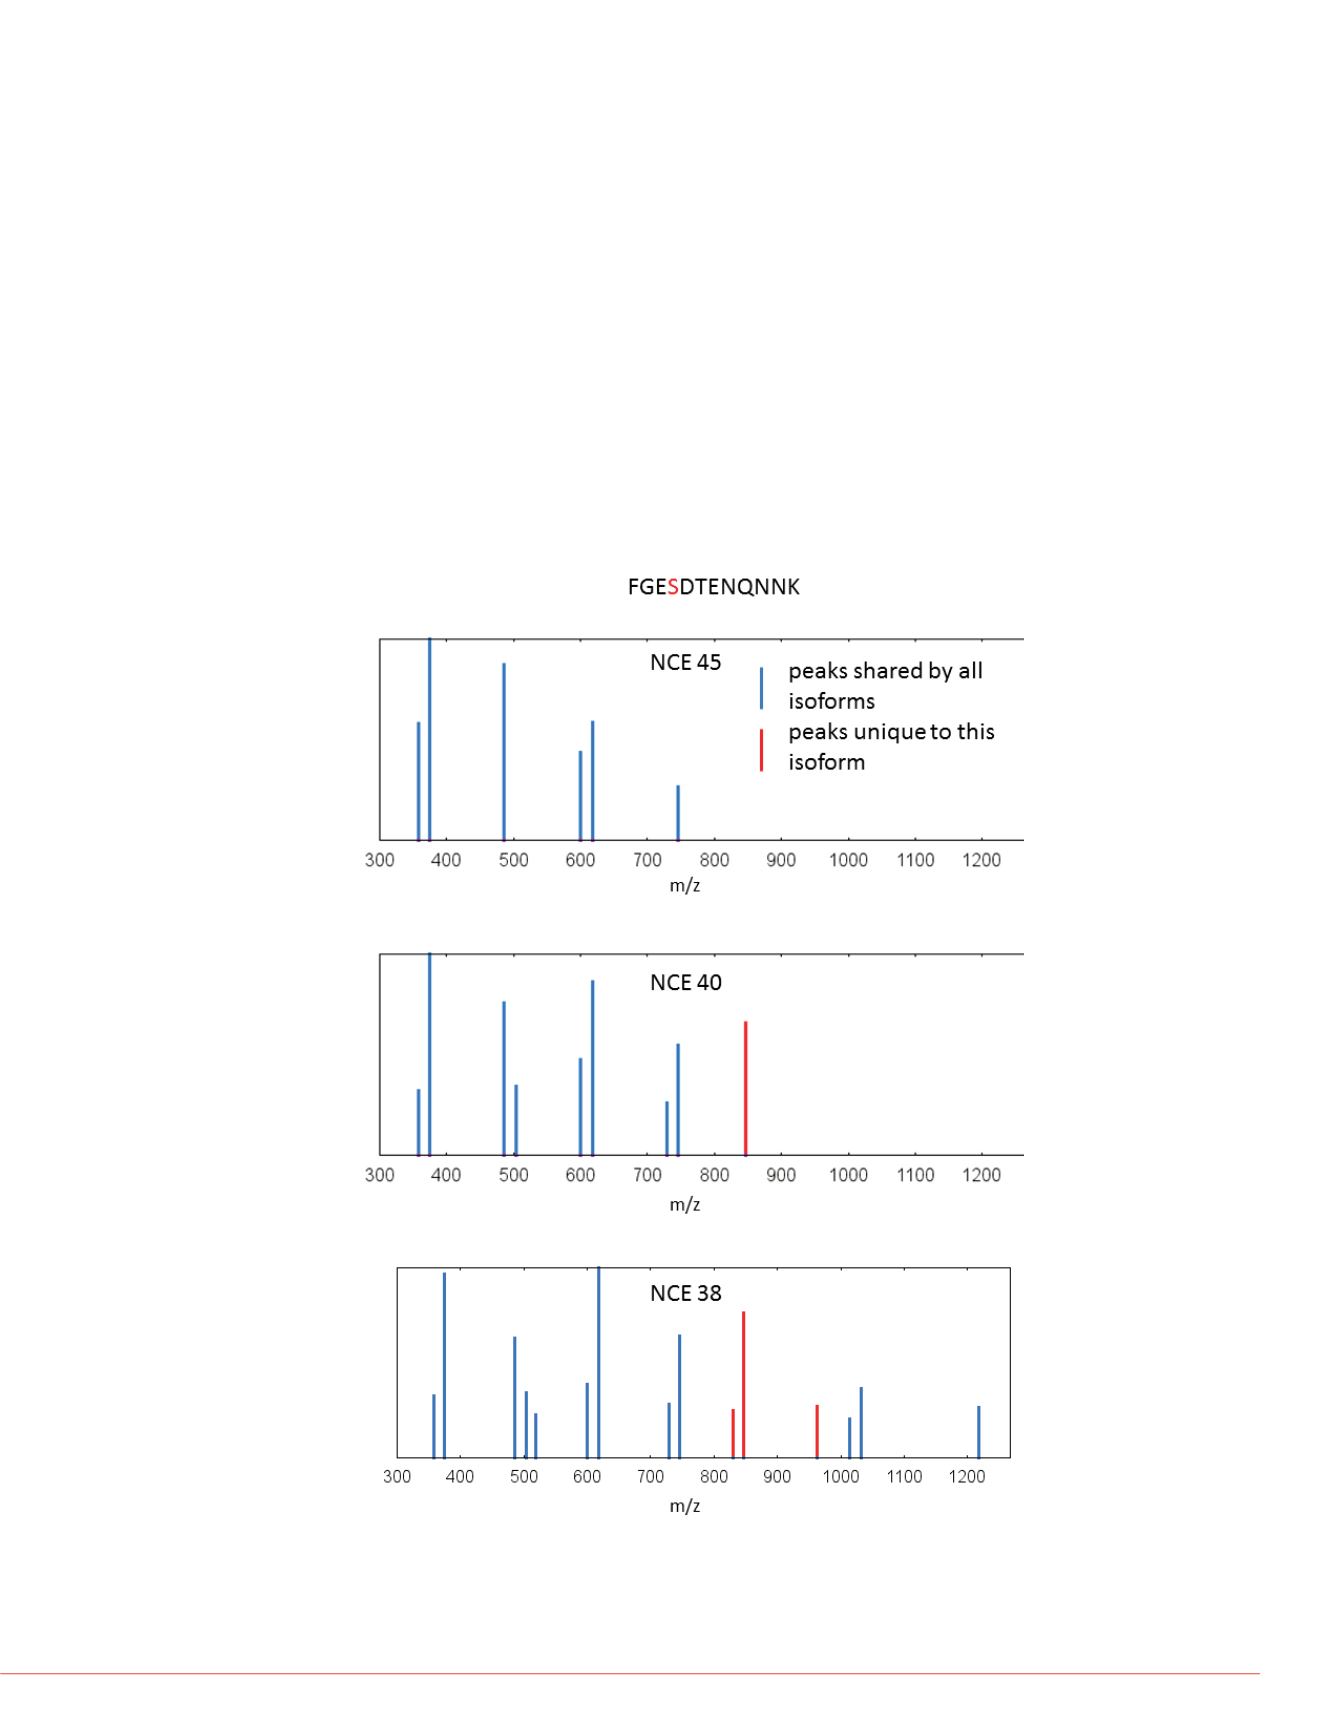
FIGURE 5. Library spectra for one isoform of peptide FGESDTENQNNK
acquired at different normalized collision energies (NCE). Peaks are color-
coded according to which isoforms they are common to. Blue peaks are
predicted for both isoforms. Red peaks are predicted only for this isoform
(modified at serine [S], position 4).
FIGURE 6. Library spectra fo
phosphorylation sites in red.
precursor +2, 19 observation
observations for modificatio
was seen for these isobaric
between them and it is not o
b- or y-ions are seen in one f
also substantially different.
Adjusting Normalized Collision Energy can Produce Diagnostic Peaks
Fragmenting a peptide at different normalized collision energies (NCE) can result in
different observed peaks. When our initial spectra did not yield any diagnostic peaks,
we tried different NCE values. Figure 5 illustrates one peptide at three different
collision energies, each with a slightly different fragmentation pattern. For lower NCE
values we see more diagnostic peaks unique to this isoform. This trend was common
for many but not all of the 43 peptides examined.
In The Absence of Diagnostic Peaks
We find that theoretically diagnostic peaks specific to one modified isoform are not
always observed. In those cases, the library reveals less-easily predicted differences.
Figure 6 illustrates an example of how different relative intensities can distinguish
between isoforms even if all of the same peaks are observed in both spectra.
libraryʼs consolidated spectrum
xamples of three of the observed
TTT
S
PKKYYLAEK
are shown as processed by the
d spectrum contains only the
peptide STFHAGQLR. Red S or T
hosphrylation. Peaks are color-
ommon to. One peak is unique to
rms are only observed in one.
oth but
rm
peaks predicted and
observed in only one isoform
All trademarks are the property of Therm
This information is not intended to encou
intellectual property rights of others.


