
3
Thermo Scienti c Poster Note
•
PN ASMS13_W602_BFrewen_E 07/13S
es phosphorylated at specific
ed methods.
spho-peptides and compile
e sequences modified at
n inform targeted assay
lation have created a keen
ever, they present unique
is less predictable than
n of reliable fragment ions to
oforms that are not
plication in that one must rely
t modified forms since all forms
sitions, we turned to empirical
nces containing between 2 and
ey were mixed into pools of 8
sequence were mixed together.
C-trap dissociation (HCD)
uired on a Thermo Scientific™
r each peptide were acquired by
s an averaged spectrum from
and activation type. A software
ions for all peptide isoforms in
ns. Red letter indicates a
uilt in the library when there
e peptides were observed at
Results
Retention Time Does Not Resolve Most Isobaric Peptides
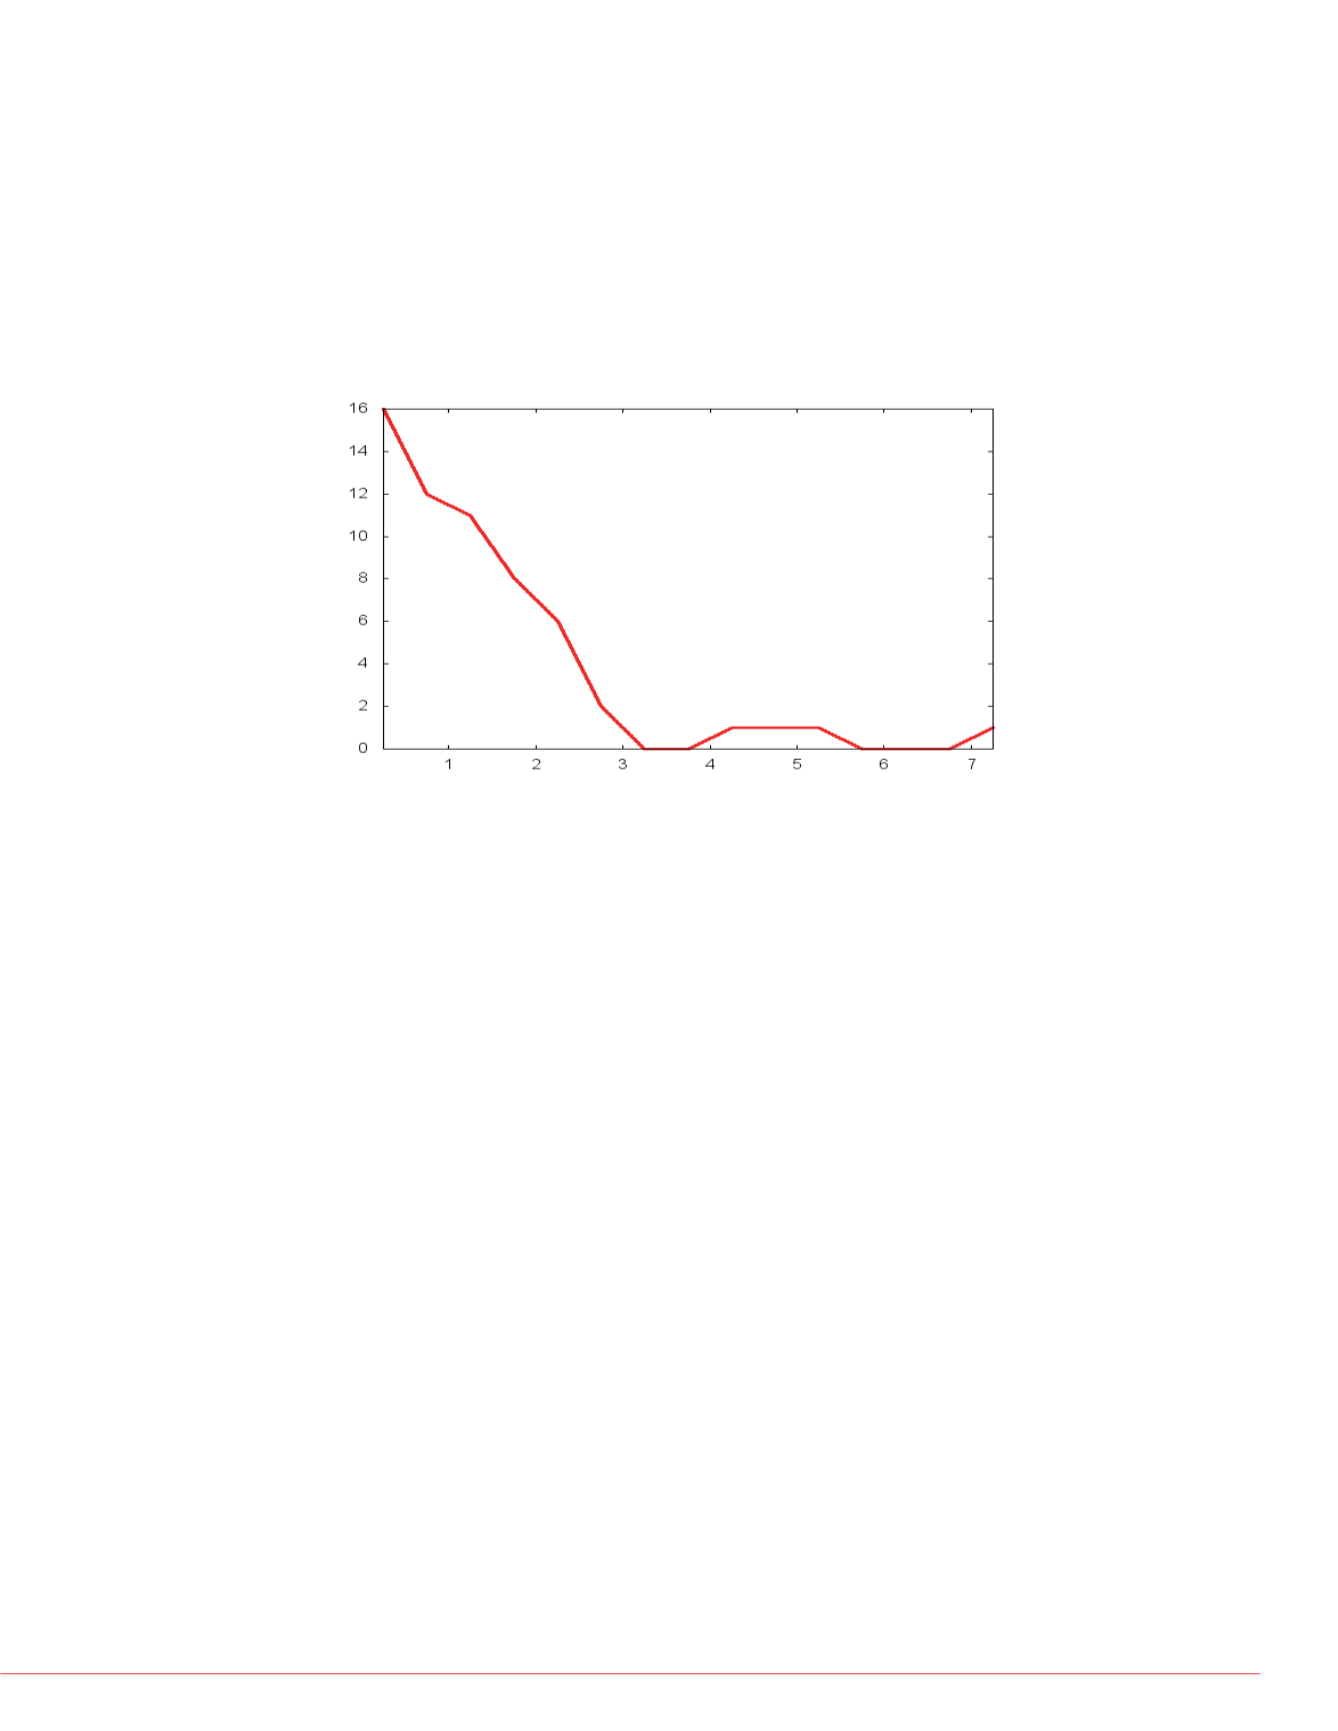
We compared the retention time of each peptide to its other modified forms. The
majority of peptides eluted within a minute of each other on a 60-minute gradient,
which may not be enough separation to confidently differentiate one from another
(Figure 2).
FIGURE 2. Histogram of retention time separation of pairs of isobaric phospho-
peptides on a 60-minute gradient. For example, the peptide LQTVHSIPLTINK
phosphorylated at position 3 (T) eluted just 3 seconds before the same peptide
phosphorylated at position 6 (S).
Library Consolidated Spectra Illustrate Diagnostic Peaks
The spectrum library combines all observed spectra for a peptide, keeping only those
peaks that are common to the majority of spectra. This is a distinct advantage over
using a single observation to design targeted assays as it accounts for variability seen
even in high-intensity fragment ions (Figure 3).
The library also provides a mechanism for finding and storing fragment ions that differ
between isobaric peptides. Ideally, one could predict which y-ions will shift with the
different location of a phosphorylation. Figure 4 illustrates such an example. The y
8
ion
is the only one predicted to differ between the two isoforms of singly-phosphorylated
STFHAGQLR. The y
8
2+
ion is observed in both spectra. Since this is not the case for
all peptides, we considered several alternative strategies for differentiating between
isoforms.
FIGURE 3. Variability of fragment
built from the seven spectra obse
CID spectra, precursor charge +2
(phosphorylated serine). The obs
library (noise peaks removed). Th
peaks shared across the observe
FIGURE 4. Library spectra for tw
in the peptide sequence indicate
coded according to which isofor
each isoform. Some peaks predic
peaks predicted and
observed for both isoforms
peak
obse
HCD
Phospopeptide sequence
HCD
+3
+2 +3 +4 +3
SSSFREMDGQPER
S
SSFREMDGQPER
S
S
SFREMDGQPER
SS
S
FREMDGQPER
SSSPTQYGLTK
S
SSPTQYGLTK
S
S
SPTQYGLTK
SS
S
PTQYGLTK
SSSP
T
QYGLTK
STFHAGQLR
S
TFHAGQLR
S
T
FHAGQLR
STLVLHDLLK
S
TLVLHDLLK
S
T
LVLHDLLK
STVASMMHR
S
TVASMMHR
STVA
S
MMHR
VKEEGYELPYNPATDDYAVPPPR
VKEEGYELP
Y
NPATDD
Y
AVPPPR
VKEEG
Y
ELPYNPATDD
Y
AVPPPR
VQTTPPPAVQGQK
VQ
T
TPPPAVQGQK
VQT
T
PPPAVQGQK
YIEDEDYYK
YIEDED
Y
YK
YIEDEDY
Y
K
ctrum
Consolidated spectrum
CID
Difference in elution time of
peptide isoform pairs in minutes
Number of peptide isoform pairs
A
B
C
D


