
4
A Phospho-Peptide Spectrum Library for Improved Targeted Assays
ic Peptides
o its other modified forms. The
other on a 60-minute gradient,
y differentiate one from another
ion of pairs of isobaric phospho-
, the peptide LQTVHSIPLTINK
econds before the same peptide
FIGURE 5. Library spectra fo
acquired at different normali
coded according to which is
predicted for both isoforms.
(modified at serine [S], positi
stic Peaks
ra for a peptide, keeping only those
This is a distinct advantage over
ys as it accounts for variability seen
and storing fragment ions that differ
ict which y-ions will shift with the
strates such an example. The y
8
ion
isoforms of singly-phosphorylated
ectra. Since this is not the case for
tegies for differentiating between
Adjusting Normalized Collisi
Fragmenting a peptide at differ
different observed peaks. Whe
we tried different NCE values.
collision energies, each with a
values we see more diagnostic
for many but not all of the 43 p
In The Absence of Diagnosti
We find that theoretically diagn
always observed. In those cas
Figure 6 illustrates an example
between isoforms even if all of
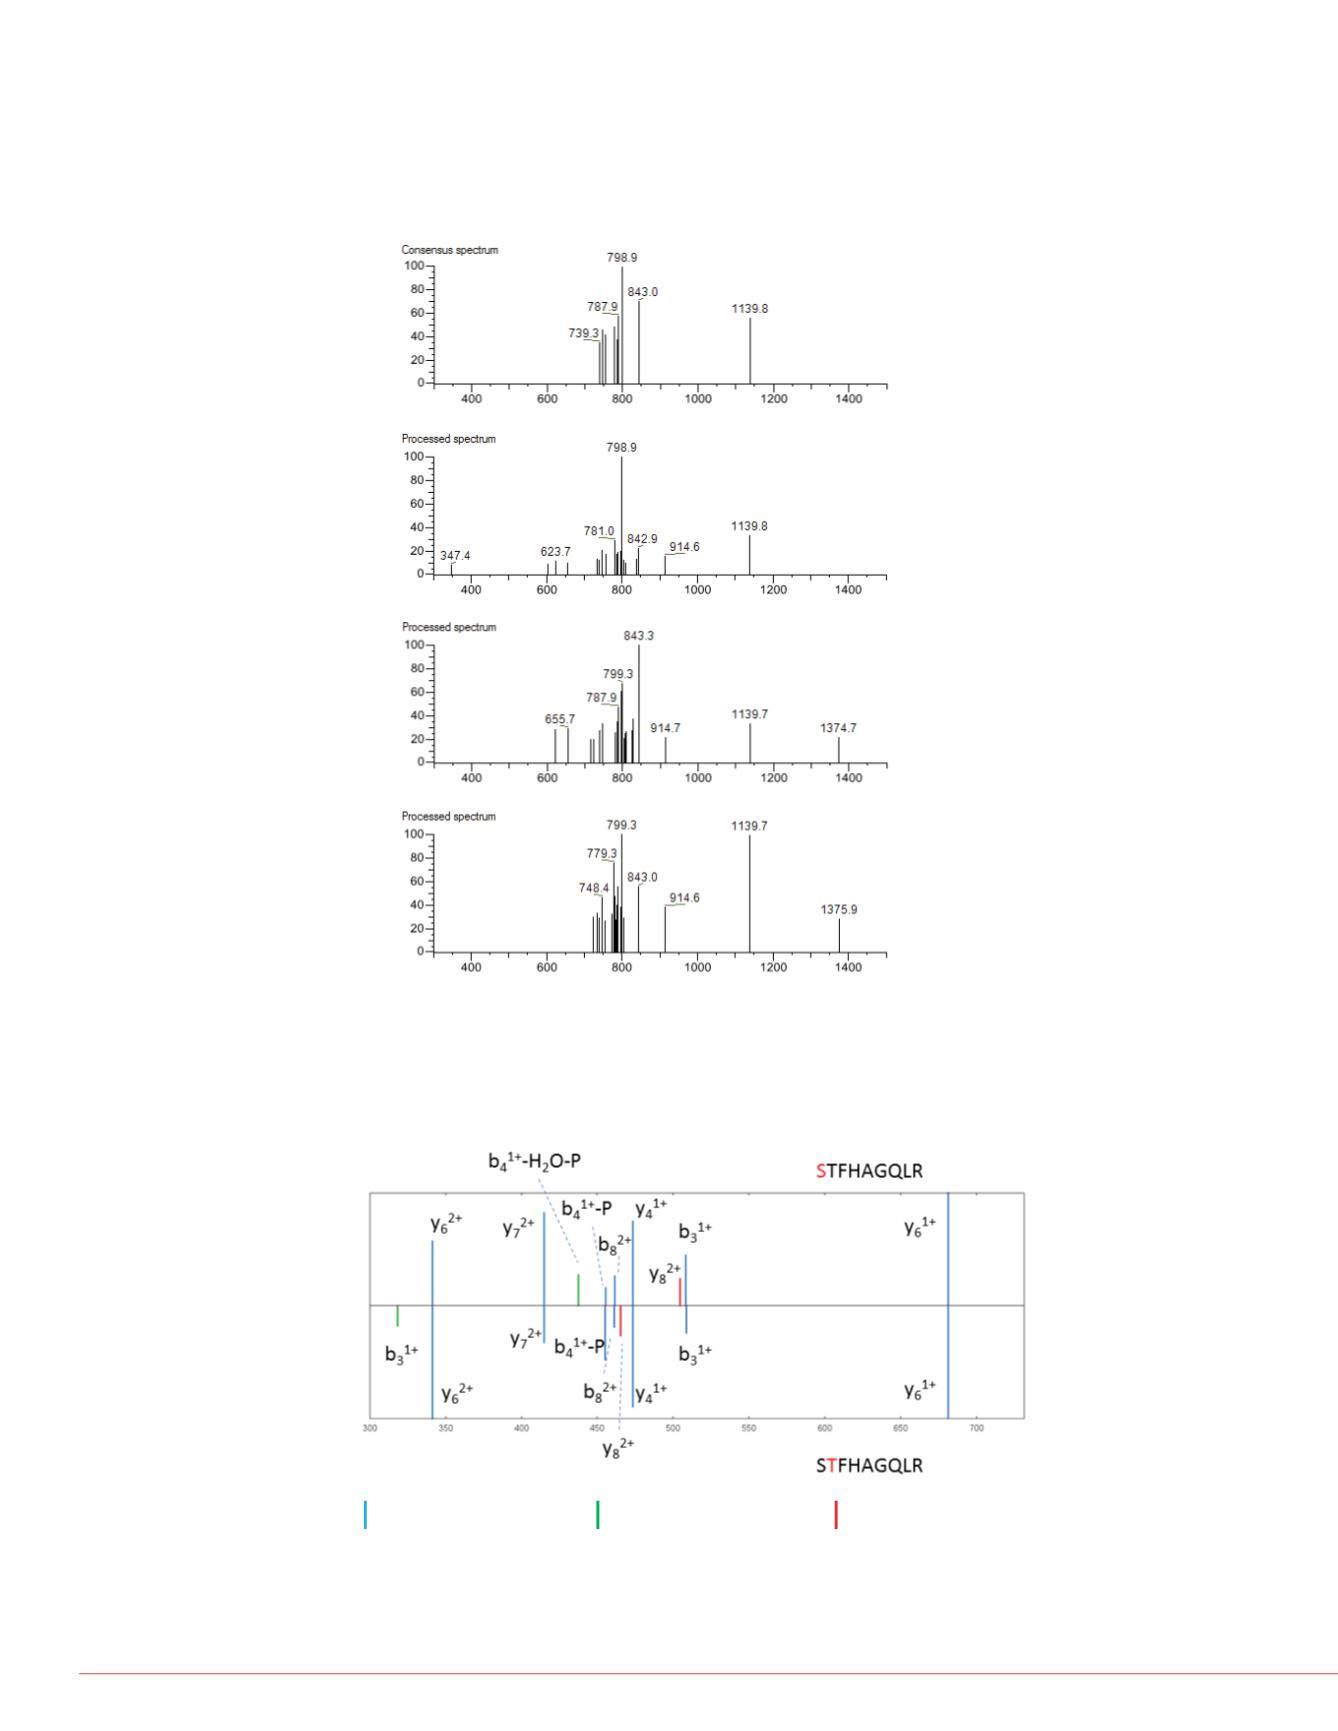
FIGURE 3. Variability of fragmentation. (A) The libraryʼs consolidated spectrum
built from the seven spectra observed. (B–D) Examples of three of the observed
CID spectra, precursor charge +2 for peptide ETTT
S
PKKYYLAEK
(phosphorylated serine). The observed spectra are shown as processed by the
library (noise peaks removed). The consolidated spectrum contains only the
peaks shared across the observed spectra.
FIGURE 4. Library spectra for two isoforms of peptide STFHAGQLR. Red S or T
in the peptide sequence indicates the site of phosphrylation. Peaks are color-
coded according to which isoforms they are common to. One peak is unique to
each isoform. Some peaks predicted in both forms are only observed in one.
peaks predicted and
observed for both isoforms
peaks predicted for both but
observed in one isoform
peaks predicted and
observed in only one isoform
tion time of
irs in minutes
A
B
C
D


