
3
Thermo Scienti c Poster Note
•
PN63781_E 03/13S
titative screening of 18 anabolic
alyzed with a 15 min. LC gradient, and
d for fragments in MS2 spectrum
xcept for 6
β
-Hydroxyfluoxymesterone
L, and it was lower for compounds
tor. Matrix effects were not observed:
alyzed with calibration standards
ich mimic effects of testosterone and
ease protein synthesis within cells
lly in muscles. Use of anabolic steroids
as doping and is banned by major
Q Exactive™ ultra high resolution
city and sensitivity.
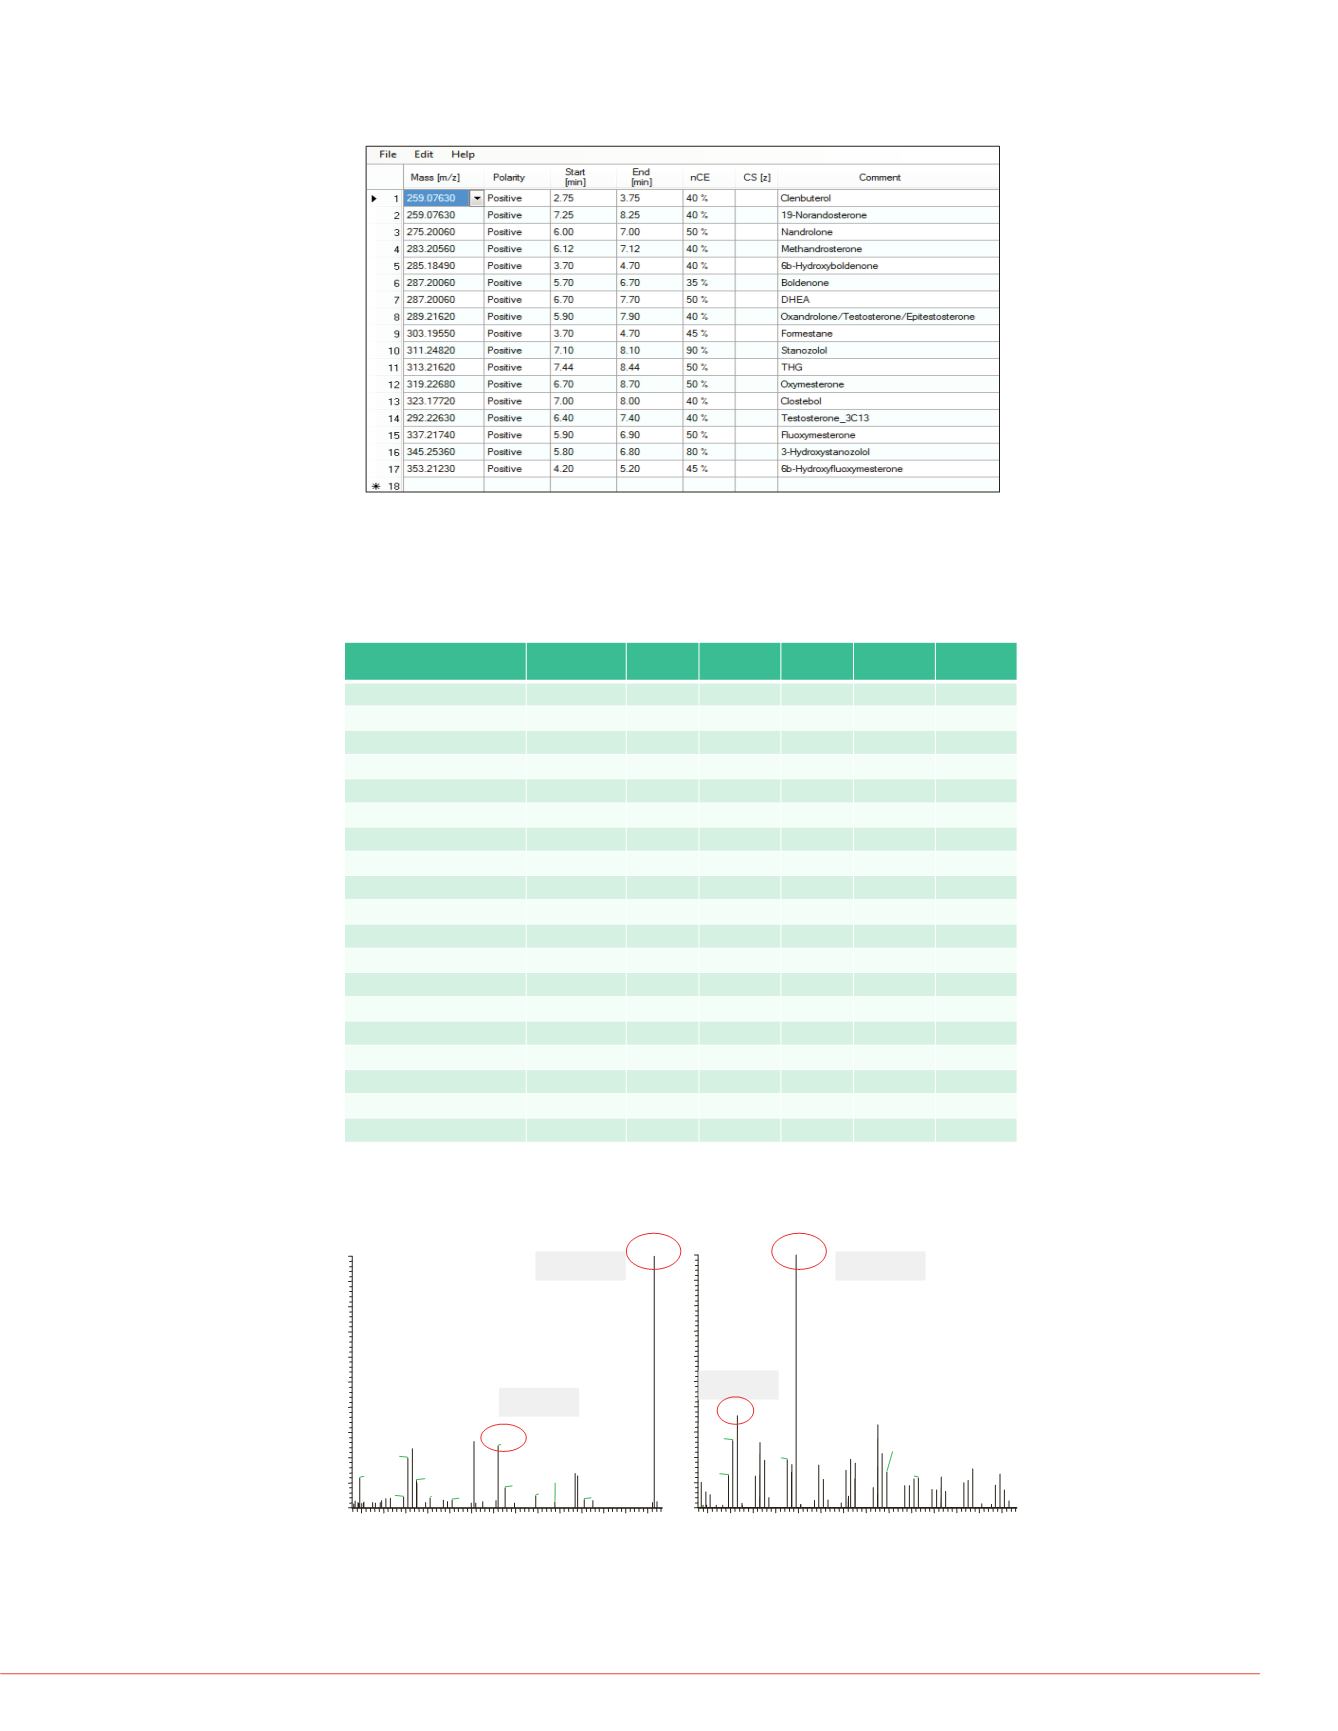
Figure 1. MS method inclusion list
add 40 µL of internal standard
) and 1 mL MTBE
perature
FIGURE 2. MS2 spectra for selected analytes collected for 1 ng/mL calibration standard
Data Processing
Two most abundant fragments (Table 1) in MS2 spectra (Figure 2) were selected for
quantification and confirmation. Ion ratio was calculated and EU guidelines
1
for
maximum permitted tolerance were applied.
Analyte
Formula
m/z
m/z in MS
source
Ret Time
(min)
Fragment
1
Fragment
2
Clenbuterol
C
12
H
18
Cl
2
N
2
O 277.0869 259.0763
3.2
203.0129 132.0679
19-Norandrosterone
C
18
H
28
O
2
277.2162 259.2056
7.7
241.1942 145.1007
Nandrolone
C
18
H
26
O
2
275.2006 275.2006
6.5
109.0647 83.0494
Methandrosterone
C
20
H
28
O
2
301.2161 283.2056
6.6
173.0956 147.0800
6
β
-Hydroxyboldenone
C
29
H
26
O
3
303.1955 285.1849
4.3
121.0645 147.0798
Boldenone
C
19
H
26
O
2
287.2006 287.2006
6.2
121.0648 135.1166
DHEA
C
19
H
28
O
2
289.2162 287.2006
7.2
97.0653 109.0651
Oxandrolone
C
19
H
30
O
3
307.2268 289.2162
6.4
135.1165 121.1012
Testosterone
C
19
H
28
O
2
289.2162 289.2162
6.9
97.0651 109.0650
Epitestosterone
C
19
H
28
O
2
289.2162 289.2162
7.4
97.0651 109.0650
Formestane
C
19
H
26
O
3
303.1955 303.1955
4.2
121.0649 171.0802
Stanozolol
C
21
H
32
N
2
O 329.2587 311.2482
7.6
81.0542 107.0857
THG
C
21
H
28
O
2
313.2162 313.2162
7.9
241.1576 159.0798
Oxymesterone
C
20
H
30
O
3
319.2268 319.2268
7.2
113.0595 125.0593
Clostebol
C
19
H
27
ClO
2
323.1772 323.1772
7.5
143.0254 131.0254
Fluoxymesterone
C
20
H
29
FO
3
337.2173 337.2173
6.4
241.1576 131.0851
3-Hydroxystanozolol
C
21
H
32
N
2
O
2
345.2536 345.2536
6.3
97.0400 107.0855
6
β
-Hydroxyfluoxymesterone C
20
H
29
FO
4
353.2122 353.2123
4.7
95.0857 239.1419
Testosterone-
13
C
3
C
16
13
C
3
H
28
O
2
292.2263 292.2263
6.9
100.0753 112.0751
Table 1. List of analytes, m/z values for parent ion and fragments in MS2 spectrum
Results
3
4
5
6
7
8
Time (min)
0
50
100
0
50
100
0
50
100
0
50
100
Relative Abundance
0
50
100
0
50
100 RT:3.17
RT:7.56
RT:6.51
6.88
RT:6.58
RT:4.31
RT:6.20
4
0
50
100
0
50
100
0
50
100
0
50
100
Relative Abundance
0
50
100
0
50
100
RT:4.3
4
4.23
Clenbuterol
19-Norandrosterone
*
Nandrolone
Methandrosterone
6
β
-Hydroxyboldenone
Boldenone
T
Linearity Range, LOQ, LOD
Table 2. Linearity ranges, LOQ, LOD
Analyte
Linearity
Clenbuterol
1-150 ng/
19-Norandrosterone
1-1500 n
Nandrolone
3-150 ng/
Methandrosterone
1-600 ng/
6
β
-Hydroxyboldenone
1-600 ng/
Boldenone
1-600 ng/
DHEA
1-600 ng/
Oxandrolone
1-1500 n
Testosterone
1-300 ng/
Epitestosterone
1-600 ng/
Formestane
1-600 ng/
Stanozolol
1-300 ng/
THG
1-600 ng/
Oxymesterone
1-300 ng/
Clostebol
1-150 ng/
Fluoxymesterone
1-300 ng/
3-Hydroxystanozolol
1-60 ng/
6
β
-Hydroxyfluoxymesterone
6-150 ng/
Figure 3. Chromatographic peaks re
of 1 ng/mL (*3 ng/mL, **6 ng/mL)
energies specified in method
e windows.
1ng
RT:
3.07
AV:
1
NL:
3.62E4
F:
FTMS+pAPCI corona
Fullms2259.08@hcd40.00 [50.00-550.00]
70 80 90 100 110 120 130 140 150 160 170 180 190 200
m/z
0
10
20
30
40
50
60
70
80
90
100
Relative Abundance
203.0133
121.0648132.0680
93.0370
90.9771
167.0370
69.0706
95.0162
135.1165
149.1323
89.0600 101.0599
171.1163
111.0442
157.8262
71.0862
1ng
RT:
6.37
AV:
1
NL:
6.19E4
F:
FTMS+pAPCI corona
Fullms2275.20@hcd50.00 [50.00-580.00]
70 80 90 100 110 120 130 140 150 160 170 180 190 200
m/z
0
10
20
30
40
50
60
70
80
90
100
Relative Abundance
109.0650
83.0497
145.1010
81.0704 93.0702
133.1010
105.0702
119.0856
187.1478
149.1323
199.1479
79.0547
173.1321
163.1115
69.0705
Clenbuterol
Qualifier
Quantifier
Qualifier
Quantifier
Nandrolone
Figure 4. Calibration curves for selec


