
4
LC-MS Quantitative Screening Method for 18 Anabolic Steroids in Oral Fluid Using MS2 Spectra Data Collected with Q Exactive Orbitrap Mass Spectrometer
tes collected for 1 ng/mL calibration standard
S2 spectra (Figure 2) were selected for
calculated and EU guidelines
1
for
m/z in MS
source
Ret Time
(min)
Fragment
1
Fragment
2
69 259.0763
3.2
203.0129 132.0679
62 259.2056
7.7
241.1942 145.1007
06 275.2006
6.5
109.0647 83.0494
61 283.2056
6.6
173.0956 147.0800
55 285.1849
4.3
121.0645 147.0798
06 287.2006
6.2
121.0648 135.1166
62 287.2006
7.2
97.0653 109.0651
68 289.2162
6.4
135.1165 121.1012
62 289.2162
6.9
97.0651 109.0650
62 289.2162
7.4
97.0651 109.0650
55 303.1955
4.2
121.0649 171.0802
87 311.2482
7.6
81.0542 107.0857
62 313.2162
7.9
241.1576 159.0798
68 319.2268
7.2
113.0595 125.0593
72 323.1772
7.5
143.0254 131.0254
73 337.2173
6.4
241.1576 131.0851
36 345.2536
6.3
97.0400 107.0855
22 353.2123
4.7
95.0857 239.1419
63 292.2263
6.9
100.0753 112.0751
rent ion and fragments in MS2 spectrum
3
4
5
6
7
8
Time (min)
0
50
100
0
50
100
0
50
100
0
50
100
Relative Abundance
0
50
100
0
50
100 RT:3.17
RT:7.56
RT:6.51
6.88
RT:6.58
RT:4.31
RT:6.20
4
5
6
7
8
Time (min)
0
50
100
0
50
100
0
50
100
0
50
100
Relative Abundance
0
50
100
0
50
100
RT:7.10
RT:6.33
RT:6.88
RT:7.23
RT:4.33
4.51
4.23
RT:7.41
RT:6.88
5
6
7
8
Time (min)
0
50
100
0
50
100
0
50
100
0
50
100
Relative Abundance
0
50
100
0
50
100
RT:7.75
RT:7.09
RT:7.39
RT:6.36
RT:6.12
RT:4.74
Clenbuterol
19-Norandrosterone
*
Nandrolone
Methandrosterone
6
β
-Hydroxyboldenone
Boldenone
Testosterone
13
C
3
Stanozolol
Formestane
Testosterone
Epitestosterone
Oxandrolone
DHEA
THG
Oxymesterone
Clostebol
Fluoxymesterone
3-Hydroxystanozolol
**
6
β
-Hydroxyfluoxymesterone
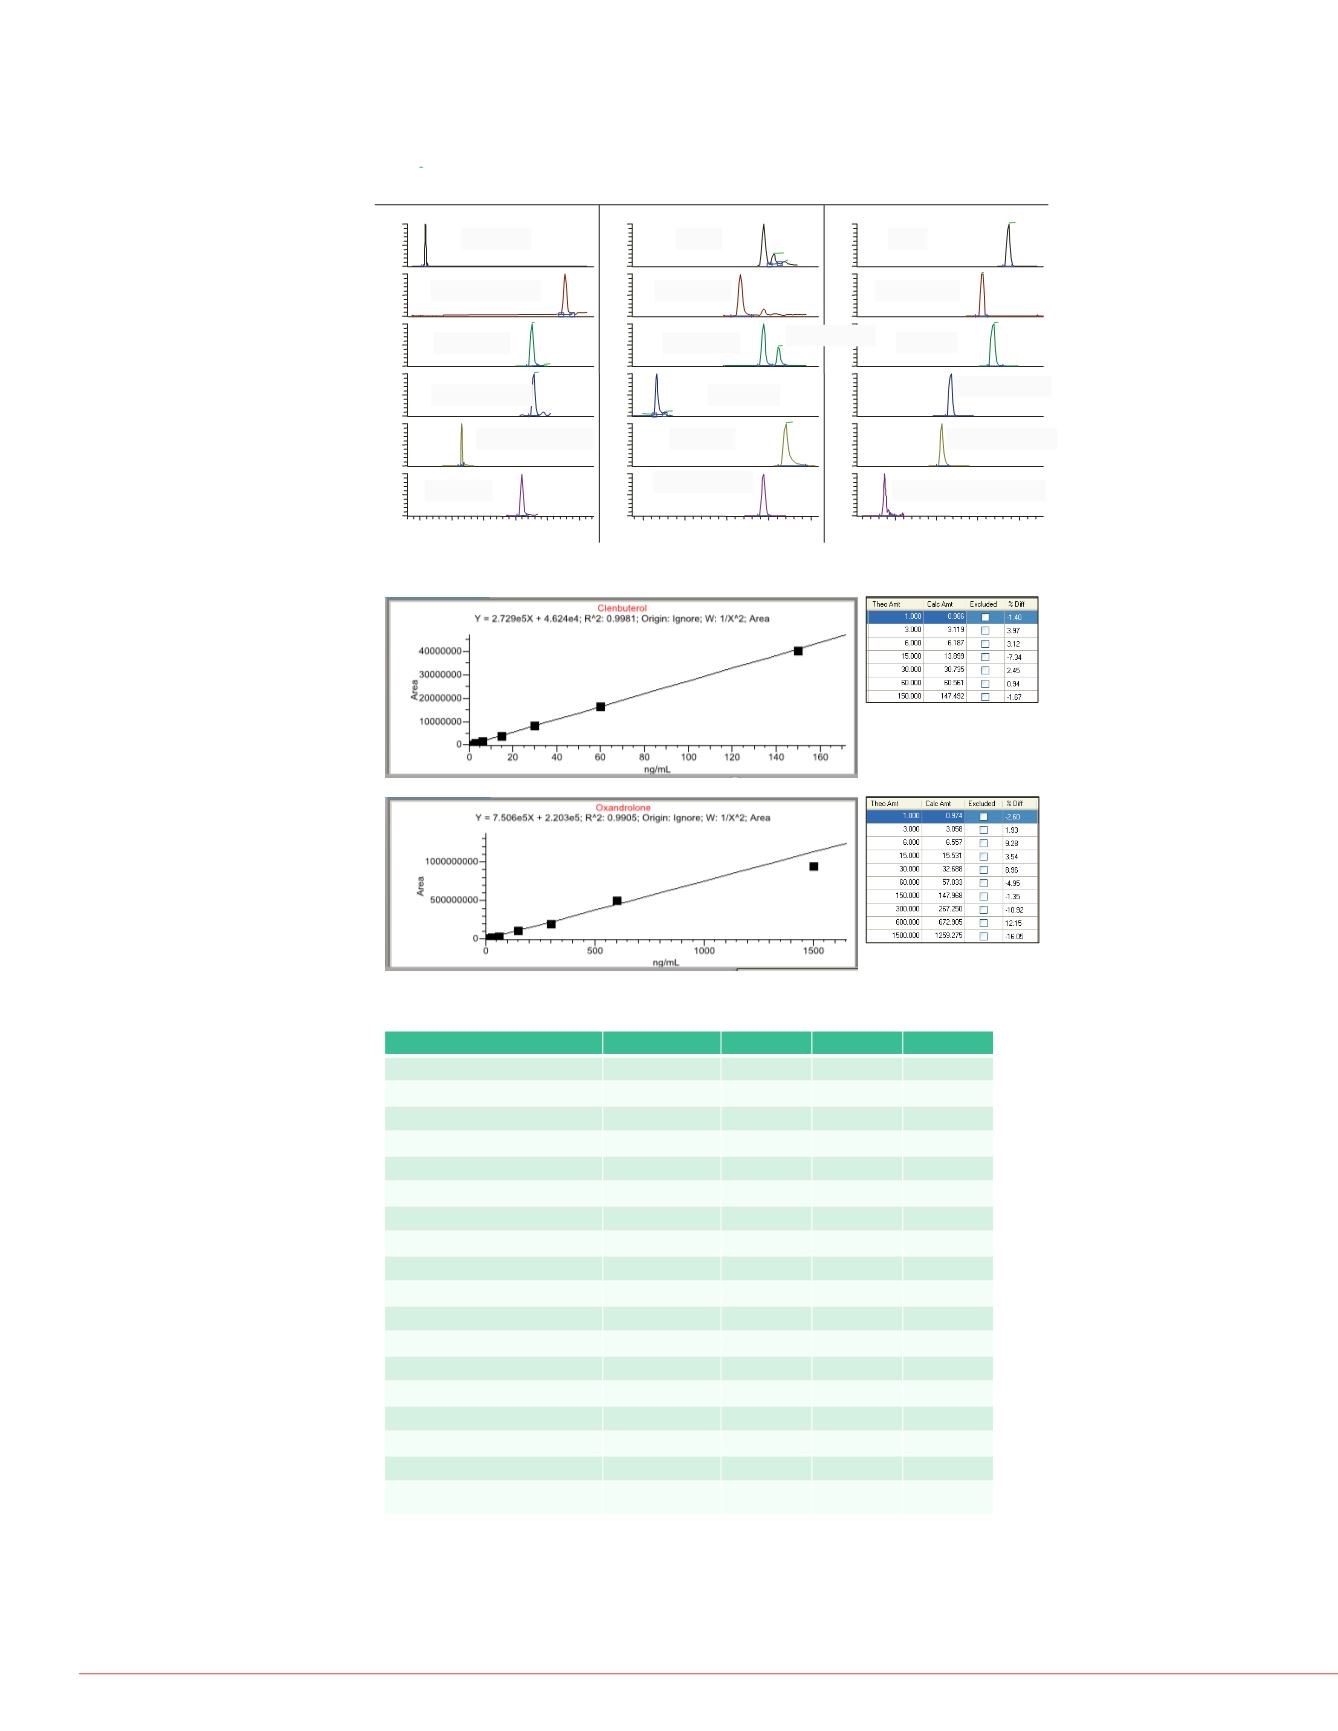
Linearity Range, LOQ, LOD
Table 2. Linearity ranges, LOQ, LOD
Analyte
Linearity range
R
2
LOQ
LOD
Clenbuterol
1-150 ng/mL
0.9981
1 ng/mL
<1 ng/mL
19-Norandrosterone
1-1500 ng/mL 0.9937
1 ng/mL
< 1 ng/mL
Nandrolone
3-150 ng/mL
0.9926
3 ng/mL
<1 ng/mL
Methandrosterone
1-600 ng/mL
0.9931
1 ng/mL
<1 ng/mL
6
β
-Hydroxyboldenone
1-600 ng/mL
0.9852
1 ng/mL
<1 ng/mL
Boldenone
1-600 ng/mL
0.9939
1 ng/mL
<1 ng/mL
DHEA
1-600 ng/mL
0.9898
1 ng/mL
<1 ng/mL
Oxandrolone
1-1500 ng/mL 0.9905
1 ng/mL
<1 ng/mL
Testosterone
1-300 ng/mL
0.9896
1 ng/mL
<1 ng/mL
Epitestosterone
1-600 ng/mL
0.9889
1 ng/mL
<1 ng/mL
Formestane
1-600 ng/mL
0.9882
1 ng/mL
<1 ng/mL
Stanozolol
1-300 ng/mL
0.9911
1 ng/mL
<1 ng/mL
THG
1-600 ng/mL
0.9914
1 ng/mL
<1 ng/mL
Oxymesterone
1-300 ng/mL
0.9923
1 ng/mL
<1ng/mL
Clostebol
1-150 ng/mL
0.9961
1 ng/mL
<1 ng/mL
Fluoxymesterone
1-300 ng/mL
0.9916
1 ng/mL
<1 ng/mL
3-Hydroxystanozolol
1-60 ng/mL
0.9952
1 ng/mL
<1 ng/mL
6
β
-Hydroxyfluoxymesterone
6-150 ng/mL
0.9838
6 ng/mL
3 ng/mL
Method Precision
QC samples with concentrations a
450 ng/mL) were prepared in blan
separate batches to obtain intra- a
Figure 3. Chromatographic peaks reconstructed with m/z accuracy of 5 ppm at LOQ
of 1 ng/mL (*3 ng/mL, **6 ng/mL)
Matrix Effect
Matrix effects (Table 4) were eval
concentrations of 2 ng/mL, 10 ng
calibration standards prepared in
Analyte
Clenbuterol
19-Norandrosterone
Nandrolone
Methandrosterone
6
β
-Hydroxyboldenone
Boldenone
DHEA
Oxandrolone
Testosterone
Epitestosterone
Formestane
Stanozolol
THG
Oxymesterone
Clostebol
Fluoxymesterone
3-Hydroxystanozolol
6
β
-Hydroxufluoxymesterone
ND: not detected; *concentration (1.61 ng
1ng
RT:
6.37
AV:
1
NL:
6.19E4
F:
TMS+pAPCI corona
Fullms2275.20@hcd50.00 [50.00-580.00]
70 80 90 100 110 120 130 140 150 160 170 180 190 200
m/z
0
10
20
30
40
50
60
70
80
90
100
Relative Abundance
109.0650
83.0497
145.1010
81.0704 93.0702
133.1010
105.0702
119.0856
187.1478
149.1323
199.1479
79.0547
173.1321
163.1115
69.0705
Qualifier
Quantifier
Nandrolone
Figure 4. Calibration curves for selected analytes
Table 3. Intra-assay and inter-a
Table 4. Percent recovery in sp
Analyte
2 ng/mL 15
Clenbuterol
<10.5
19-Norandrosterone
<12.4 <
Nandrolone
NA
Methandrosterone
<13.1 <
6
β
-Hydroxyboldenone
<7.9
<
Boldenone
<15.1
DHEA
<16.6 <
Oxandrolone
<11.0 <
Testosterone
<14.6
Epitestosterone
<16.4 <
Formestane
<10.4 <
Stanozolol
<20.9 <
THG
<19.5 <
Oxymesterone
<25.0
Clostebol
<14.8 <
Fluoxymesterone
<18.0
3-Hydroxystanozolol
<15.1
6
β
-Hydroxyfluoxymesterone
NA
<


