


 180 / 658

2
LC-MS Quantitative Screening Method for 18 Anabolic Steroids in Oral Fluid Using MS2 Spectra Data Collected with Q Exactive Orbitrap Mass Spectrometer
Overview
Purpose:
To develop a sensitive method for quantitative screening of 18 anabolic
steroids in oral fluid.
Methods:
Samples were processed with LLE, analyzed with a 15 min. LC gradient, and
compounds were identified with ion ratio calculated for fragments in MS2 spectrum
Results:
The LLOQ was 1ng/mL for all analytes except for 6
β
-Hydroxyfluoxymesterone
(6 ng/mL). The UPLQ was between 60-1500 ng/mL, and it was lower for compounds
producing high signal in mass spectrometer detector. Matrix effects were not observed:
percent recovery in spiked blank oral fluid and analyzed with calibration standards
prepared in solvent was in range 78.5-118%.
Introduction
Androgenic-anabolic steroids (AAS) are drugs which mimic effects of testosterone and
dihydrotestosterone in the human body. They increase protein synthesis within cells
which results in buildup of cellular tissue, especially in muscles. Use of anabolic steroids
by athletes to increase body weight is referred to as doping and is banned by major
sporting bodies.
In this work we implemented Thermo Scientific™ Q Exactive™ ultra high resolution
mass spectrometer to ensure high method specificity and sensitivity.
Figure 1. MS method inclusi
Methods
Sample Preparation - LLE
1. To 200 µL of oral fluid (in preservation buffer), add 40 µL of internal standard
solution (10 µg/mL Testosterone
13
C
3
in MeOH) and 1 mL MTBE
2. Vortex, let samples rest for 5 min. at room temperature
3. Store samples for 30 min. at -20 °C
4. Transfer solvent upper layer to glass tube
5. Evaporate at 37 °C
6. Reconstitute in 50% MeOH
7. Inject 30 µL of the sample onto LC-MS
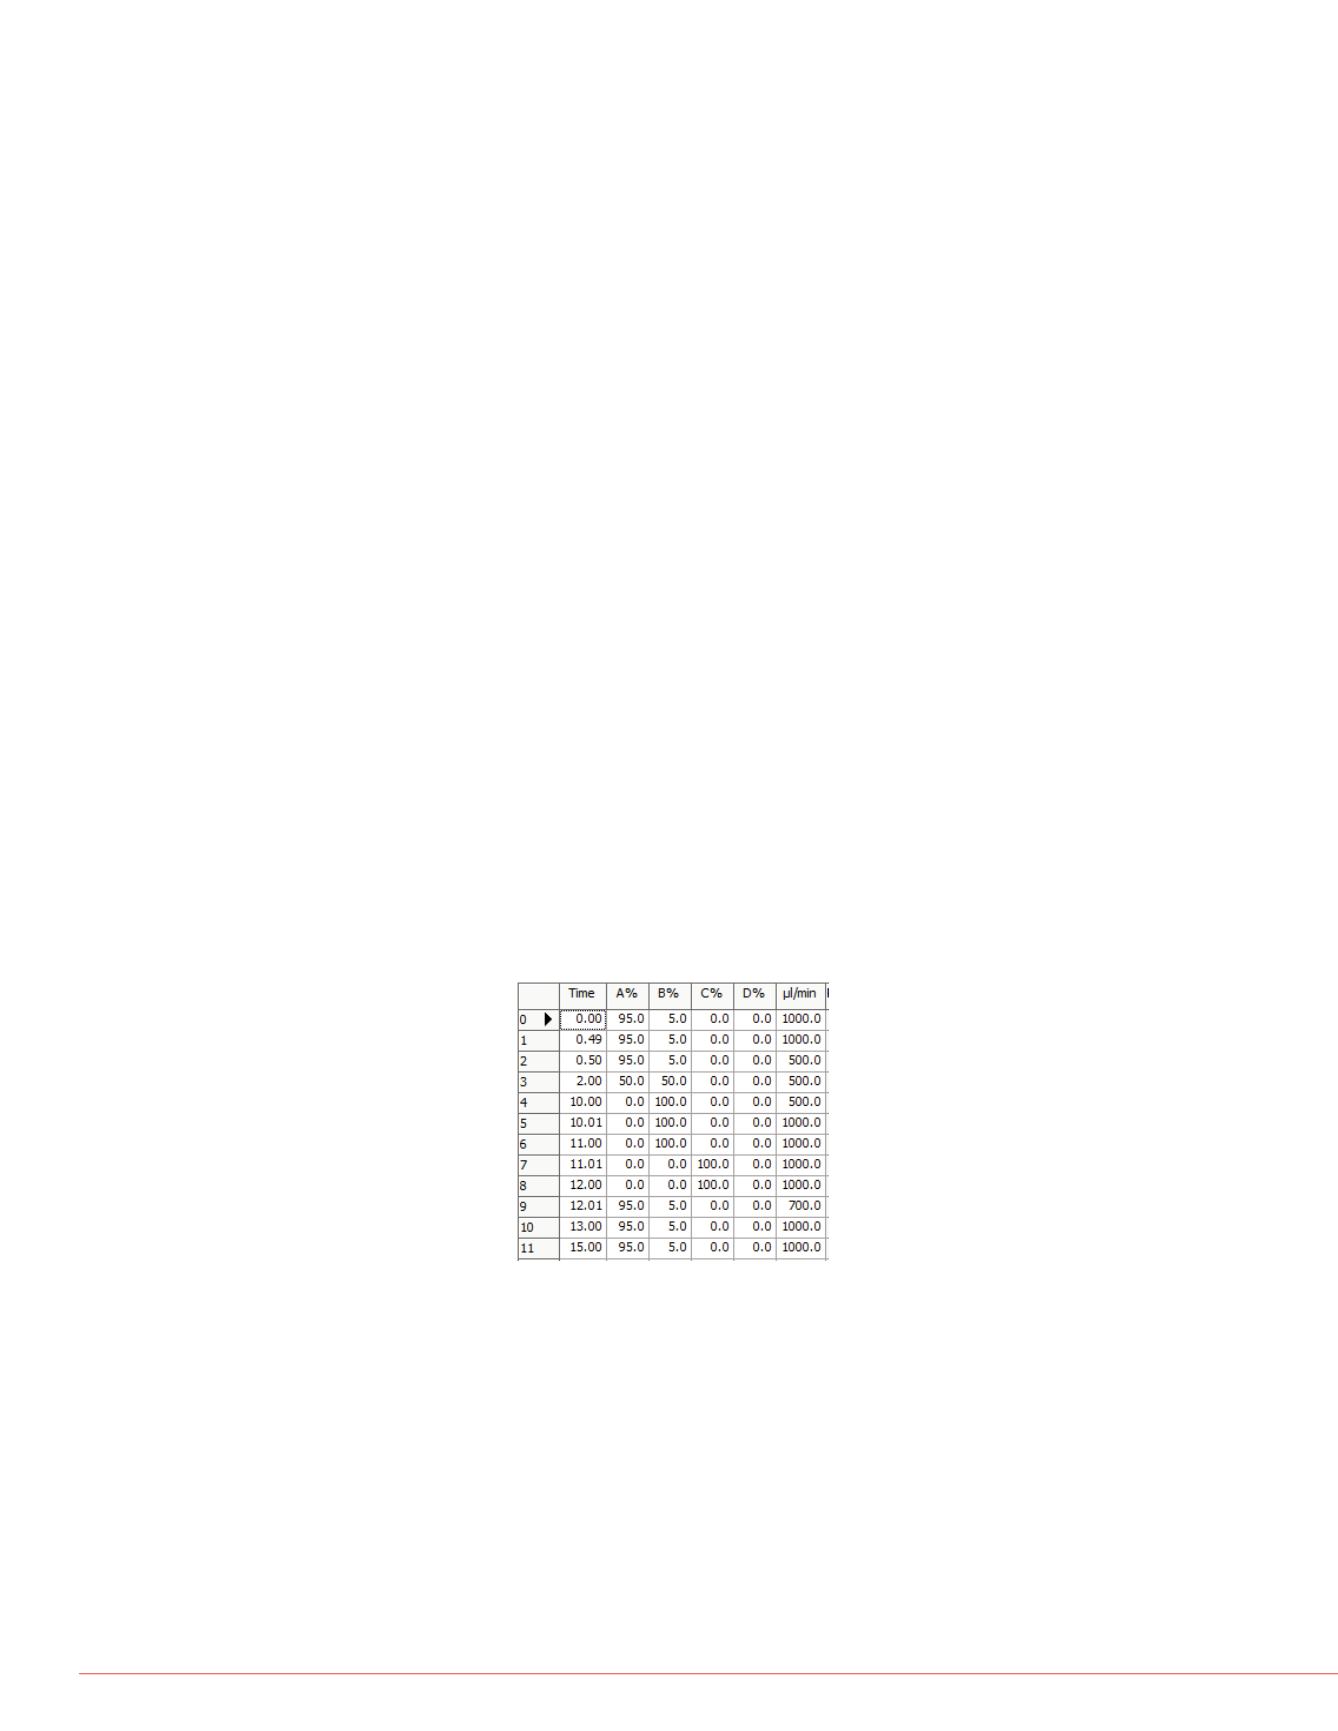
Liquid Chromatography
Column: Thermo Acucore C18, 100x3 mm, 2.6 µm
Mobile phase:
A: 0.2% Formic Acid in DIW
B: 0.1% Formic Acid in MeOH
C: ACN/IPA/Acetone=45/45/10 v/v/v
LC gradient:
FIGURE 2. MS2 spectra for sel
Data Processing
Two most abundant fragments (
quantification and confirmation.
maximum permitted tolerance
Analyte
For
Clenbuterol
C
12
H
18
C
19-Norandrosterone
C
18
H
28
Nandrolone
C
18
H
26
Methandrosterone
C
20
H
28
6
β
-Hydroxyboldenone
C
29
H
26
Boldenone
C
19
H
26
DHEA
C
19
H
28
Oxandrolone
C
19
H
30
Testosterone
C
19
H
28
Epitestosterone
C
19
H
28
Formestane
C
19
H
26
Stanozolol
C
21
H
32
N
THG
C
21
H
28
Oxymesterone
C
20
H
30
Clostebol
C
19
H
27
C
Fluoxymesterone
C
20
H
29
F
3-Hydroxystanozolol
C
21
H
32
N
6
β
-Hydroxyfluoxymesterone C
20
H
29
F
Testosterone-
13
C
3
C
16
13
C
3
Table 1. List of analytes, m/z v
Results
Mass Spectrometer
Ionization source: APCI
Resolution: 35K
Isolations width: 2 mu
AGC target: 2e5
Maximum IT = 250 ms
Acquisition mode: t-MS2
MS2 spectra are collected with optimized collision energies specified in method
inclusion list (Figure 1) together with acquisition time windows.
1ng
RT:
3.07
AV:
1
NL:
3.62E4
F:
FTMS+pAPCI corona
Fullms2259.08@hcd40.00 [50.00-550.00]
70 80 90 100 110 120 130 140 150 160 1
m/z
0
10
20
30
40
50
60
70
80
90
100
Relative Abundance
121.0648132.0680
93.0370
90.9771
167.0
69.0706
95.0162
135.1165
149.1323
89.0600 101.0599
1
111.0442
157.8262
71.0862
Clenbuterol
Qualifier
Qua