
4
Targeted Quantitation of Insulin and Its Therapeutic Analogs for Research
IA D.A.R.T.’S.. First, insulin and
h step removes background
riants are eluted into a new plate,
Quantitative Measurement of Insulin and Its Analogs
Additional limitations to high-throughput targeted quantification of insulin and its
analogs in research are inefficient sample preparation protocols that result in their lack
of analytical sensitivity and robustness. Using the insulin MSIA workflow described
above, we achieved an LLOQ and LOD of 15 pM (87 pg/mL) for the intact variants in
plasma. Quantification curves for Lantus and Apidra are shown in Figure 4. Tables 1
and 2 display LOQ and LOD.
Further, reproducibility studies demonstrated inter- and intra-day CVs of < 3%
(Tables 3 and 4) and spike and recovery resulted in recoveries of 96
–
100% (Table 5).
In addition to the improved sensitivity, the MSIA workflow significantly reduces the
background matrix. The reduced complexity affords shorter LC gradients, and,
therefore, shorter LC/MS analysis times.
t software version 1.3. Extracted
ariant were created using the
ge states. Integrated AUC values
erate the reported values.
ively scored based on
stop, apex, and tailing factors) as
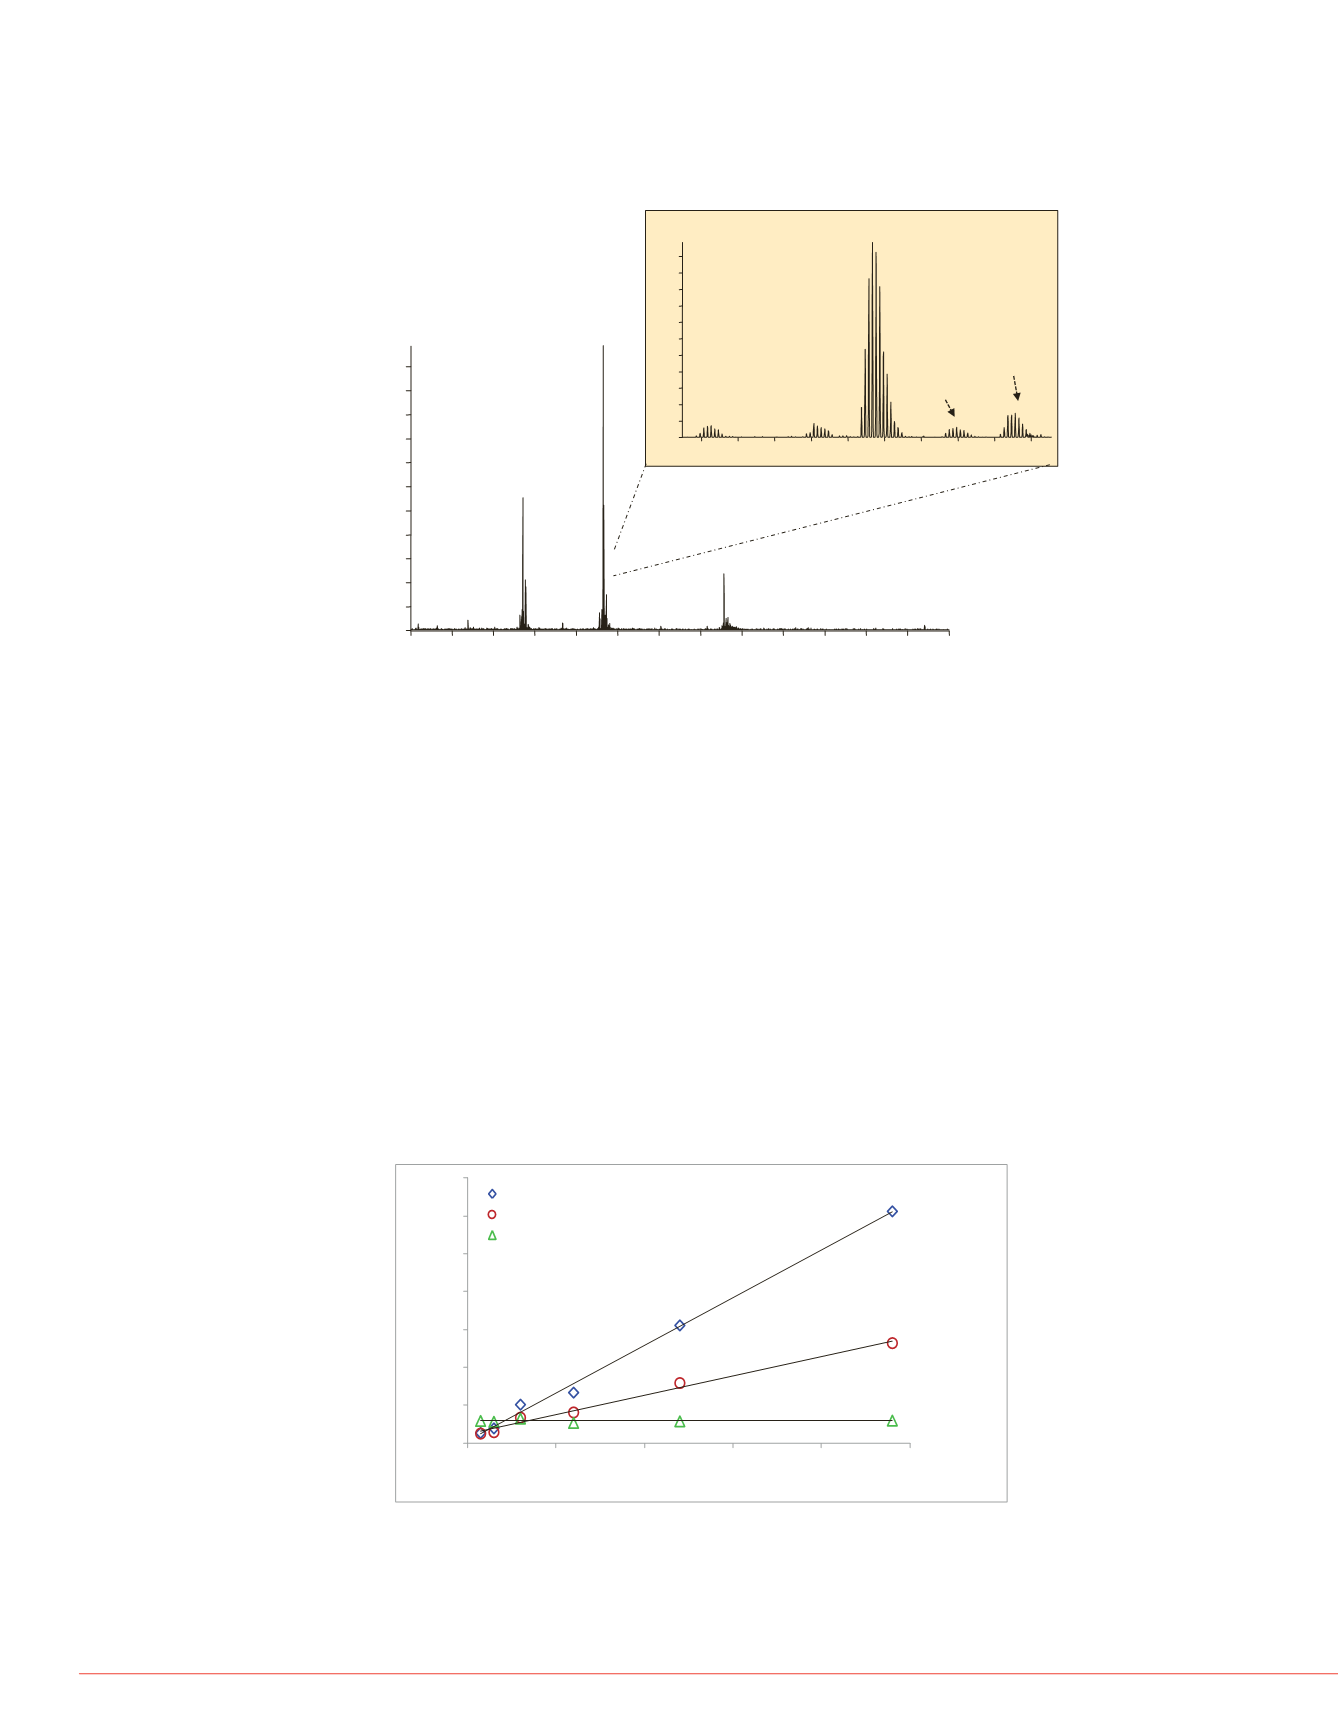
FIGURE 4. Quantification curves for Lantus and Apidra. Lantus and Apidra were
spiked into donor plasma at different concentrations. The endogenous insulin
from the donor plasma is also plotted. Since the same amount of donor plasma
was used for each sample, the level of endogenous insulin remains static. All
AUC values were normalized to the porcine AUC response.
s
alytical methods is the inability to
insulin analogs. The immobilized
nizes a common epitope region in
lyzed variants. This allows the
ple as long as the
-chain epitope
an MS mode in the analysis stage of
n of multiple insulin analogs and the
ost-acquisition.
the analytical selectivity to distinguish
the accurate mass of multiple
monstrates the HRAM data analysis
etection of insulin variants. Further,
MS acquisition can also be used to
own).
TABLE 1. Limit of quant
STD Conc.
(pM)
Me
(5 Cu
0
7.
7.5
10
15
16
30
28
60
58
120
115
240
23
480
47
960
96
TABLE 2. Limit of detect
STD Conc.
(pM)
Mean
0
2.
7.5
2.
15
4.
30
8.
TABLE 3. Intra-day repe
STD Conc.
(pM)
(3
5
50.00
TABLE 4. Inter-day rep
STD Conc.
(pM)
(3
5
50.00
Method Characteristics for
The LLOQ for the insulin MSI
Table 1), which was determin
%CV of <20% and an accura
An LOD of 15 pM (highlighte
workflow. The LLOD was det
area was greater than four st
mean total area for the blank
FIGURE 3. Simultaneous LC/MS detection of four insulin variants. Apidra
™
(0.48 nM), Humulin
®
S (0.06 nM),
Lantus
TM
(0.48 nM) ,
and porcine as the internal
standard were processed from the same sample and detected simultaneously.
The inset shows an enlargement of the 5+ charge state, and shows all three
variants. Lantus elutes 0.5 minutes prior to the three displayed insulin variants.
700 800 900 1000 1100 1200 1300 1400 1500 1600 1700 1800 1900 2000
0
1.0
2.0
3.0
4.0
5.0
6.0
7.0
8.0
9.0
10
11
Absolute Abundance (10
5
)
1156 1158 1160 1162 1164 1166 1168 1170 1172 1174
m/z
0
1
2
3
4
5
6
7
8
9
10
11
Absolute Abundance (10
5
)
[M+4H
+
]
4+
[M+5H
+
]
5+
[M+6H
+
]
6+
Apidra
Porcine
Humulin® S
Apidra
TM
+ Na
+
Apidra
TM
+ K
+
y = 0.0252x + 0.1087
R²= 0.996
y = 0.0103x + 0.463
R²= 0.9883
0
2
4
6
8
10
12
14
0
100
200
300
400
500
AUCRatio
[insulin variant:porcine]
Lantus/Glulisine Amount Spiked in per Sample (pM)
Lantus
Apidra
Endogenous Insulin
m was used for all data extraction.
d by converting area-under-the-curve
rnal reference, which was calculated


