


 75 / 302

The response of the standards decreased over time.
However, when using freshly prepared standards, the
response remained constant; this suggests there may be
temperature stability issues with the samples. Although
excellent short-term (30 hour) stability yielded standard
deviations less than 5%, using a refrigerated autosampler
and an isotopically-labeled internal standard will help
minimize systematic sample degradation and response
variation.
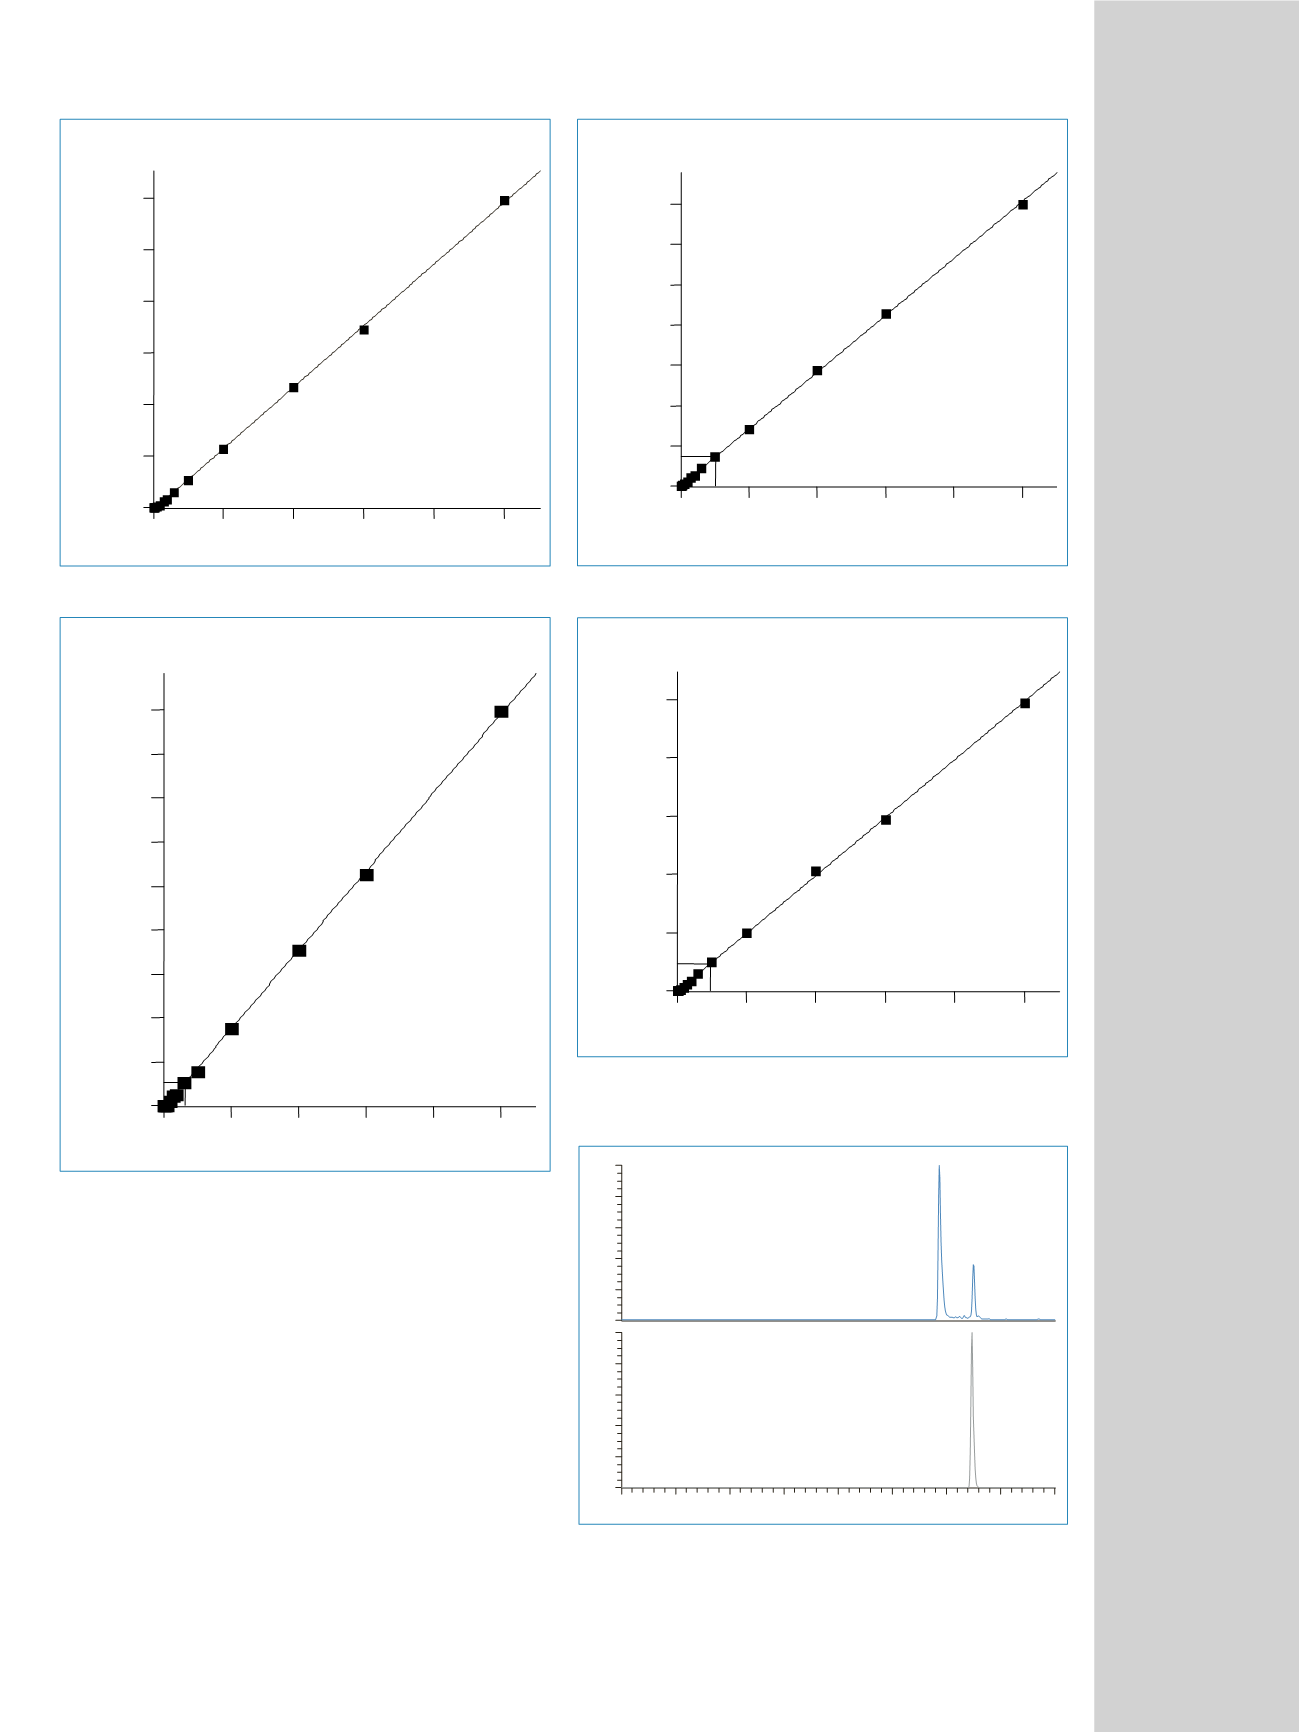
AMPA_63
Y = -9223.87+23897.5*X R^2 = 0.9997 W: Equal
0
10
20
30
40
50
ppb
0
200000
400000
600000
800000
1000000
1200000
Area
AMPA_79
Y = -10278.6+35908.4*X R^2 = 0.9997 W: Equal
0
10
20
30
40
50
ppb
0
200000
400000
600000
800000
1000000
1200000
1400000
1600000
1800000
Area
Glyphosate_150
Y = 10661.8+141089*X R^
2 = 0.9997 W: Equal
0
10
20
30
40
50
ppb
0
1000000
2000000
3000000
4000000
5000000
6000000
7000000
Area
Glyphosate_79
Y = -5192.82+49777.1*X R^2 = 0.9996 W: Equal
0
10
20
30
40
50
ppb
0
500000
1000000
1500000
2000000
2500000
Area
0
5
10
15
20
25
30
35
40
Time (min)
0
20
40
60
80
100
0
20
40
60
80
100
RelativeAbundance
29.32
32.47
32.39
Figure 3. The calibration curve of the SRM 110
→
79 for AMPA.
Figure 4. The calibration curve of the SRM 168
→
150 for glyphosate.
Figure 5. The calibration curve of the SRM 168
→
79 for glyphosate.
Figure 6. The total ion chromatogram (TIC) of 5 ppb of glyphosate and AMPA
spiked into a matrix of chloride, nitrate, carbonate and sulfate.
Figure 2. Calibration curve of the 110
→
63 SRM transition for AMPA.